Kevin Hillstrom: MineThatData

Exploring How Customers Interact With Advertising, Products, Brands, and Channels, using Multichannel Forensics.

January 01, 2009

Churn Rates Mask Retention Problems

We frequently read about a metric called "Churn Rate".
For subscription-based services, the churn rate illustrates the percentage of customers who leave the service in any given month.

Typically, churn rates look favorable. A company will report a monthly churn rate of 6%, suggesting that it keeps 94% of subscribers each month.

But churn rate has a damaging cumulative impact that can be illustrated on an annual basis.

For instance, a 6% monthly churn rate yields an annual retention rate of just 48% (1 - 0.06) %^ 12.

In the Multichannel Forensics framework, monthly churn rates translate as follows.
  • Retention Mode (60% or Greater Annual Retention) = Less Than 4% Monthly Churn.
  • Hybrid Mode (40% to 60% Annual Retention) = 4% to 7% Monthly Churn.
  • Acquisition Model (0% to 40% Annual Retention) = Greater Than 7% Monthly Churn.
In other words, if your monthly churn is less than 4%, you're in Retention Mode. If your monthly churn is greater than 7%, you are in Acquisition Mode.

Labels: , ,

July 28, 2008

Benchmarking Repurchase Rates

We enjoy comparing ourselves to others, don't we?

Now you might not be able to pull annual repurchase rate out of your web analytics or business intelligence solution. But you might be able to pull annual purchase frequency out of your information system.

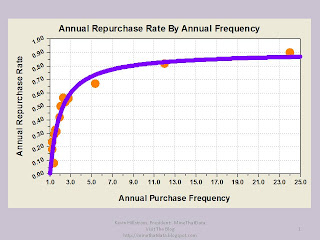
The attached graph indicates a relationship between annual purchase frequency, and annual repurchase rate. Annual repurchase rate is important, because it determines if you are in Acquisition Mode, Hybrid Mode, or Retention Mode. The mode you are in determines the type of business model you operate. It determines your sole purpose in life as a marketer.

If your customers order fewer than 1.75 times per year, it is most likely that your business is in Acquisition Mode. You retain fewer than 40% of last year's buyers. Your job is to constantly "fill the funnel" with new customers, or your business won't grow.

If your customers order between 1.75 and 3.00 times per year, it is most likely that your business is in Hybrid Mode, the most enjoyable mode for an executive to operate. You balance customer acquisition and customer retention activities.

If your customers order more than three times per year, it is most likely that your business is in Retention Mode. Roll out the loyalty program, because you have to find a way to increase annual purchase frequency --- you're not likely to move the annual repurchase rate much.

The table below allows you to identify if your annual repurchase rate is above or below average. Here are approximate averages, given annual purchase frequency (your mileage will vary depending upon your customer acquisition strategy and merchandise assortment).
  • 1.25 Annual Orders = 18% Annual Repurchase Rate
  • 1.50 Annual Orders = 30% Annual Repurchase Rate
  • 1.75 Annual Orders = 39% Annual Repurchase Rate
  • 2.00 Annual Orders = 45% Annual Repurchase Rate
  • 2.33 Annual Orders = 52% Annual Repurchase Rate
  • 2.67 Annual Orders = 57% Annual Repurchase Rate
  • 3.00 Annual Orders = 60% Annual Repurchase Rate
  • 3.50 Annual Orders = 65% Annual Repurchase Rate
  • 4.00 Annual Orders = 68% Annual Repurchase Rate
  • 5.00 Annual Orders = 73% Annual Repurchase Rate
  • 7.00 Annual Orders = 78% Annual Repurchase Rate
  • 10.00 Annual Orders = 82% Annual Repurchase Rate
  • 24.00 Annual Orders = 87% Annual Repurchase Rate.

Labels: , , ,

July 13, 2008

Multichannel Forensics A to Z: Acquisition Mode

We begin a series on Multichannel Forensics (study, book) with the letter "A". Our first topic is "Acquisition Mode".

In Acquisition Mode, you retain fewer than 40% of last year's customers. In other words, if 1,000 customers purchased merchandise from your brand in 2007, fewer than 400 will purchase again during 2008.

Too often, we take a "Starbucks" view of the world, one where there is a 40% chance that Starbucks will retain our business today! In those situations, we think about loyalty programs and all the stuff that goes into cross-selling and up-selling the customer --- it's all about getting more from the customer today.

The majority of the brands I study retain fewer than forty percent of last year's customers, in fact, many retain less than thirty percent of last year's customers.

The media, trade journals, and vendor community seldom focus on this business model. A business can make a boatload of money catering to customers who purchase infrequently --- how often do you buy from your local furniture store, after all? Somehow, they stay in business (most of 'em!).

For products, brands or channels locked in Acquisition Mode, it doesn't make sense to try to increase loyalty, as the pundits would have you do. Instead, have a steely-eyed focus on acquiring/reactivating customers at the lowest cost possible.

Labels: ,

May 18, 2008

The Long Term Impact Of Sluggish Sales In 2008

Many folks are telling me that business in the multichannel direct-to-consumer world is down an aggregate 15% to 25% compared to 2007.

Poor performance manifests itself in the short term, and in the long term. Worse, it manifests itself in a harsh manner across brands/channels in Retention Mode.

Take a look at the table below:

Long-Term Impact Of Bad Performance In 2008


Retention Retention Acquisition Acquisition

Mode Mode Mode Mode

No Cuts And Cuts No Cuts And Cuts


2008 -20.2% -23.9% -19.4% -23.3%
2009 -9.6% -16.8% -6.6% -7.4%
2010 -7.0% -11.9% -2.8% -3.5%
2011 -4.3% -8.7% -1.9% -1.9%
2012 -2.8% -6.1% -1.1% -1.1%

A business in retention mode (annual repurchase rate > 60%) feels the pain much longer than a business in acquisition mode (annual repurchase rate < 40%).

In the table above, we compare what happens when 2008 is down about 20% to 2007, but the business immediately rebounds to normal levels for 2009 - 2012.

The retention mode business is down almost ten percent in 2009 because of a bad 2008, down seven percent in 2010 because of a bad 2008. And then factor in our natural reaction to cut marketing expense --- which accelerates the downturn in 2009 - 2012. This is where many of our retention mode businesses are heading, especially those trimming marketing expense to "get through 2008".

Notice that the acquisition mode business is not hurt nearly as bad. Because this business depends upon new customers, it rebounds quickly.

In an economic downturn, knowing the mode your business is in (Retention, Hybrid, Acquisition) means everything to making marketing expenditure decisions. Run the metrics, and understand what current day decisions mean to the long-term health of your business.

Labels: , , , ,

May 08, 2008

An Example: Applying A Life Table To A Problem

How often do we launch new products, brands, or services, only to realize that sales are not meeting expectations?

Expectations are a challenge, because we have to make an educated guess as to what might happen in the future.

Within a few months, we actually have enough data to make another educated
guess ... we can predict the annual repurchase rate for a product, brand or channel.

In this case, our brand launched a new product. After six months, the product is not meeting expectations. Our CEO asks us to understand if the small number of customers who purchased this product are "loyal" to the product.

We ask our SAS programmers or information technology experts to run a query for us. We identify every customer who purchased our new product, to date. For each purchase, we bring along the customer_id, as well as the order date. The dataset is sorted by customer_id and order date.

Next, we re-shape the datasets, adding a column for the order date of the first purchase of merchandise from this product classification for a customer. We then scan the database. Any customer who ordered a second time has the order date for the second purchase put into another column.

If I purchased two times, my row of data looks something like this:
  • Kevin .......... Date1 = 20080115 .......... Date2 = 20080507
If I purchased just one time, my row of data looks something like this:
  • Kevin .......... Date1 = 20080115 .......... Date2 = NULL.
Now we need to re-shape the dataset one more time. In this case, we calculate how many months pass between the first and second purchase. If no second purchase occurred, we instead calculate the total amount of time that passed. If no second purchase occurred, we create a new variable that tells us no second purchase occurred. If I purchased two times, my row of data looks something like this:
  • Kevin Months = 04 .......... Second Purchase = YES
If I purchased one time, my row of data looks something like this:
  • Kevin Months = 04 .......... Second Purchase = NO
We're almost there! Now we summarize the dataset, creating one row per each unique value of months between purchases. We sum the number of customers who purchased after "x" months. We also sum the number of people who went "x" months, through today, and have yet to purchase. These customers do not get included in the analysis after "x" months pass. The resulting life table is included in the image at the start of this post!

In the six months since launching
the new product, just under twenty percent of customers buying the product chose to purchase the product again.

We can extend this relationship from six months through a year. Take a peek at the modeled relationship below:


Notice the nice, smooth relationship exhibited by the data. The relationship indicates that, after twelve months, about 24% of customers will order the product again, putting the product squarely in "Acquisition Mode".

To answer the CEO's question ... it does not appear that customers are loyal to this product. It appears that if this product line is going to grow, it will grow by attracting new customers interested in a one-time purchase of this product line.

With as little as three months of purchase information, one can make a reasonably fair assessment of the anticipated annual repurchase rate of this product line.

And that, my friends, is one way that life tables can be applied to real world problems.

Labels: , ,

April 30, 2008

Can A Catalog Brand Survive As An E-Commerce Pure-Play?

The April survey question was "Can A Catalog Brand Survive As An E-Commerce Pure-Play, One That Does Not Mail Catalogs?" Here's how you responded to the survey question:

Can a catalog brand survive as an e-commerce
pureplay, one that does not mail catalogs?


Yes, Customers Will Just Shop Online 44%
Yes, But Sales Will Plummet 35%
No, The Cataloger Will Soon Be Out Of Business 21%

The reasonably even distribution of answers is congruent with the data I see across various Multichannel Forensics projects. Some companies would be out of business within a few months. Some companies would see a dramatic decrease in sales. And some companies would thrive.

Yes, Customers Will Just Shop Online:
  • Brand has a retail channel that is dominant.
  • Online channel is more than fifty percent of direct-to-consumer sales.
  • Online channel has a broader merchandise assortment than the catalog has.
  • Customer never enters catalog key-code when ordering online.
  • Brand is not "over-mailing" customers.
  • Brand is in "Retention Mode".
  • Catalog is in "Transfer Mode".
  • Customer is largely urban or suburban, age 18-45.
  • E-Mail and Paid Search performance improves in mail/holdout tests.
Yes, But Sales Will Plummet:
  • Brand does not have a retail channel, or has a small retail channel.
  • Online channel is less than fifty percent of direct-to-consumer sales.
  • Online channel has the same merchandise assortment as the catalog.
  • Customer sometimes enters catalog key-code when shopping online.
  • Brand is in "Hybrid Mode".
  • Catalog is in "Equilibrium Mode".
  • Customer is largely suburban, age 35-55.
No, The Cataloger Will Soon Be Out Of Business:
  • Brand does not have a retail channel.
  • Online channel is less than thirty percent of direct-to-consumer sales.
  • Customer always enters catalog key-code when shopping online.
  • Brand is in "Acquisition Mode".
  • Catalog is in "Isolation Mode".
  • Customer is largely rural, age 50-80.
In my experience, these general guidelines hold up pretty well. We could get away from a catalog marketing program at Nordstrom because our customers largely fell into the first classification --- middle-aged, urban/suburban customers offered a better merchandise assortment online and in stores. But if you are a cataloger of fine cheeses with an older/rural customer base, you'd be out of business without your catalog.

Labels: , , , , , ,

February 23, 2008

Multichannel Forensics: Online/E-Commerce Startup Example For Venture Capitalists And Founders

My work is increasingly focused on internet startups, focusing on the challenge of forecasting long-term sales based on almost no customer purchase/usage history.

I try to keep things simple. Here's a business that has been in existence for less than a half year. By recency, here is the probability of a customer buying in any given month.

Recency Custs. Buyers Resp.
1 1,239 88 7.1%
2 812 47 5.8%
3 522 26 5.0%
4 279 12 4.3%

Given the limited amount of information available here, let's take a wild guess at incremental response rates for twelve months of recency.

Recency Custs. Buyers Resp.
1 1,239 88 7.1%
2 812 47 5.8%
3 522 26 5.0%
4 279 12 4.3%
5

3.7%
6

3.2%
7

2.8%
8

2.5%
9

2.3%
10

2.2%
11

2.1%
12

2.0%

Obviously, your guess is as good as mine. We have no idea what will really happen. But it is important to make a guess.

Given that guess, we can estimate a twelve month repurchase rate (using an extension of the life table as described in the Database Marketing book:
  • 1 - ((1 - 0.071) * (1 - 0.058) * (1 - 0.050) * (1 - 0.043) * (1 - 0.037) * (1 - 0.032) * (1 - 0.028) * (1 - 0.025) * (1 - 0.023) * (1 - 0.022) * (1 - 0.021) * (1 - 0.020) = 35.5%.
An annual repurchase rate of 35.5% (and the actual rate will be lower, because we average all twelve month buyers, not just following a cohort through a twelve month period) puts this startup in "Acquisition Mode".

Now you might say, "duh, they're a startup, of course they are in Acquisition Mode". And you'd be right. But we're talking about the dynamics this business will need to deal with when it becomes mature, not what it needs to do for the next few years.

The dynamics suggest that if this business survives, its number one focus will always be to aggressively acquire new customers.

Fortunately, there's time to see how the business really evolves. And as the business evolves, these estimates are re-calibrated.

VCs like this information because it gives them tangible data about the long-term trajectory of the startup. If this startup can acquire an ever-increasing number of customers in a cost-effective manner, the startup has potential. Venture Capitalists get an early glimpse into the direction the startup is headed in.


Labels: , , , ,

February 18, 2008

Multichannel Forensics: The Building Blocks

We'll start our Multichannel Forensics series with a quick refresher course.

There are three loyalty modes for every product, brand or channel.
  • Retention Mode: When at least 60% of prior year customers purchase again this year (if your business doesn't support a twelve month repurchase period, use a timeframe that is appropriate.
  • Hybrid Mode: When between 40% and 60% of prior year customers purchase again this year.
  • Acquisition Mode: When fewer than 40% of prior year customers purchase again this year.
We need to classify each product, brand or channel into one of these three modes, so that we can understand the primary way that growth will happen. So many brands are in "Acquisition Mode" and don't realize it, depending heavily on customer acquisition for long-term health.

There are also four Migration Modes that each product, brand or channel fall into.
  • Isolation Mode: This happens when the customers in a product, brand or channel do not migrate to other products, brands or channels. For instance, customers who purchase Mens apparel are unlikely to buy Womens apparel. Mens apparel buyers are in "Isolation Mode".
  • Equilibrium Mode: This happens when the customers in a product, brand or channel are willing to try other products, brands or channels. For instance, customers who purchase Womens apparel might purchase Mens apparel for their spouse. Womens apparel buyers are frequently in "Equilibrium Mode". This mode is common, and is responsible for all of the interesting dynamics that occur when customers shift from one product line (DVD Players) to another (Blu-Ray DVD Player).
  • Transfer Mode: This happens when the customers in a product, brand or channel are actively switching loyalty. Over the next decade, automobile purchasers will actively transfer loyalty from gas-guzzling cars to hybrid cars and other technologies. CEOs need to recognize this mode, and react in a positive way in order to protect jobs.
  • Oscillation Mode: Sometimes, customers switch back and forth between products, brands or channels. This is known as "Oscillation Mode". Computer buyers purchase software and peripherals, then switch back to buying a new computer, then switch to software and peripherals, resulting in "Oscillation Mode".
The combination of Loyalty Mode and Migration Mode yield the unique situation a product, brand or channel resides in.

Maybe you are a catalog CEO. If your catalog channel is in "Acquisition/Transfer" mode, your job is to scale back on catalog advertising over time, as your customers won't allow you to grow this channel anymore.

Maybe you are a Merchandise EVP. If your product is in "Retention/Isolation" mode, you thoroughly control your merchandise line. Your customers are loyal to your products, and do not switch loyalty to another merchandise line. You have the potential to be a rock star.

Maybe you are the General Manager of the Online Channel of a Multichannel Brand. If your channel is in "Hybrid/Equilibrium" mode, you have a very interesting channel to manage. Your customers want to shop your store channel, but aren't avid store customers. Strategically, you can influence your customers by the marketing techniques you use. Do you want your customers to shop online, in stores, or anywhere? In many ways, you get to decide!

This week, we'll look at several case studies, examples that help CEOs understand how to manage multichannel complexity!

Labels: , , , , , , , , ,

September 18, 2007

A Simple Example Of Multichannel Forensics

A quick way to get started with Multichannel Forensics is to measure three different factors that influence whether your business will grow, or not.

Let's assume you manage an e-commerce business.

Step 1: How many 2005 buyers did you have?

Step 2: What percentage of those buyers purchased again in 2006?

Step 3: How much did these buyers spend during 2006?

Step 4: How many other customers purchased in 2006?

Step 5: How much did these customers spend during 2006?


With these five steps, you have the components to do a very simple, high-level Multichannel Forensics analysis --- an analysis of one channel!

Here is one scenario.


Step 1 = 100,000 customers purchased in 2005.

Step 2 = 35% of these customers purchased again in 2006.

Step 3 = These customers spent $200 each.

Step 4 = 55,000 other customers purchased during 2006.

Step 5: These customers spent $100 each.


Total volume = 100,000 * 0.35 * $200 + 55,000 * 100 = $12,500,000.

Total buyers to start 2007 with = 100,000 * 0.35 + 55,000 = 90,000.


There are two key metrics to pay attention to. First, in Step 2, we notice that the annual repurchase rate is 35%. This means that the online business is in Acquisition Mode. Anytime fewer than 40% of last year's customers are retained, the business is in the business of constantly finding new customers.

There is nothing wrong with a business being in Acquisition Mode. However, notice that the business lost 65,000, and only replaced those customers with 55,000 new customers.

The business starts 2007 with 90,000 customers, ten thousand fewer customers than it started 2006 with.

Let's assume that 2007 repurchase rates and new customers are the same as in 2006. What is our demand forecast for 2007?


Forecast = 90,000 * 0.35 * 200 + 55,000 * 100 = $11,800,000.


If everything goes as forecast, the business will shrink from $12,500,000 in 2006 to $11,800,000 in 2007.

Let's assume the same trends hold in 2008. We'd start the year with 90,000 * 0.35 + 55,000 = 86,500 customers.


Forecast = 86,500 * 0.35 * 200 + 55,000 * 100 = $11,555,000.


In other words, this business will contract, unless one of three things happen.
  • The annual repurchase rate increases from 35% to maybe 40% or 45%.
  • Purchasers spend more money, on an annual basis.
  • The business significantly invests in new customer acquisition.
Businesses that are in Acquisition Mode typically struggle to dramatically increase annual repurchase rates. These businesses need to focus on new customer acquisition, in order to keep growing.

Many online businesses are going to fall into this scenario over the next 3-5 years. Once the shift of customers from traditional direct marketing to e-commerce abates, online businesses will focus on carefully managing new customer acquisition counts.

This simple example of Multichannel Forensics illustrates the power of the methodology. The business leader can see into the future, understand how sales are likely to change, and then know which levers need to be pulled to grow the business. Individual tactics (e-mail marketing, online marketing, catalogs) can be employed to achieve the objective.

Give it a try, see what it tells you about your business!

Labels: ,

May 29, 2007

Abacus, Google, And Brand Implosion

Using Abacus for customer acquisition has always been a hotly debated topic in catalog marketing.

Many circulation experts have always enjoyed their relationship with their favorite list broker. It's fun to exchange 50,000 names with Talbots, to net out 24% and realize, by default, that you share the exact same customer as your competitor. It can be a rush to test a Crutchfield 0-3 month $100+ select, and see the list work. List rental, exchange and brokerage requires gut feel, instinct, business savvy, and negotiation skills.

Then along came Abacus. You dump your housefile into their database. You then have access to modeled prospect names for something like seven cents a name. You have no idea which names you're getting, you just know their model picked "good" names, names that have an "affinity" to your brand.

At first, big companies hated this idea --- why should a big company dump six million names into the compiled list, only to realize that sixty percent of the compiled list is your customer?

Once Abacus achieved scale, all contributors theoretically benefited. Another funny thing happened along the way. The performance of Abacus names rivaled that of rented/exchanged lists. Why go through the hassle of managing 73 different lists in a mailing, when Abacus can automate the process for you?

The evolution of catalog customer acquisition is driving companies toward Abacus, away from the good folks at Millard and Mokrynski.

Everything seems peachy.

Except for one person I recently spoke with. This person made an interesting observation. He told me that almost all of his customer acquisition is from Abacus. He told me that the performance of Abacus names continues to be good. But, his housefile names are not performing well anymore.

I asked this individual what his twelve month buyer annual repurchase rate was. The answer ... thirty percent.

Remember, this individual does almost all of his customer acquisition via Abacus.

So, two years ago, this individual had 100 buyers. 30% repurchase. This person has to recruit 70 new customers ... almost all from Abacus.

In year two, there are 30 existing buyers, and 70 from Abacus. 30% of each list repurchase. This leaves us with 9 existing buyers, 21 existing buyers from Abacus, and 70 new customers from Abacus.

Within two years, 91 of 100 customers are from Abacus. Obviously, some names come from other lists, or from lapsed buyers. So let's assume that just 75 are from Abacus, not 91.

Still, in just two years, 75% of the active housefile are Abacus-sourced buyers. And this individual points out that his housefile names aren't working well anymore.

If your annual repurchase rate is in "Acquisition Mode", under forty percent, and you do the vast majority of your customer acquisition work with Abacus, you've got an interesting dilemma. In just two years, the vast majority of your active housefile is sourced from Abacus.

Remember, this individual says his housefile names no longer work well. Hmmmmmmmm.

This isn't the fault of Abacus. They are simply providing a service that clients are willing to pay for.

No, this is the fault of circulation experts. It is our fault! We're doing this to ourselves. Not smart!

Our business models participate in a big ecosystem. Unwittingly, we are moving our ecosystem away from something we control, toward something we no longer control. In this example, Abacus now owns the brand I spoke of, with housefile productivity imploding as we speak. The success or failure of the brand is no longer in control of the merchants who pick great product. Instead, the brand depends upon the type of names that Abacus makes available for the client.


And all you online marketers, if you think you're immune to this, you're not. Where do you get all of your customers from? Google? Abacus is tiny. Google owns the world. Once we've saturated the online customer market, Google plays the role for online marketers that Abacus plays for catalog marketers today.

Multichannel CEOs and CMOs: If your annual repurchase rate is under forty percent, be wary of sourcing the majority of your new customers from one vendor. The dynamics of your housefile dictate that, within just two years, that vendor determines the fate of your brand, not the product/creative/service/brand strategies you initiate.

Labels: , , , ,

March 29, 2007

Multichannel Forensics And Executive Leadership

Recall that there are two key elements in Multichannel Forensics.

First, how well do you retain your customers?
  • If you retain more than sixty percent of last year's customers (in other words, more than sixty percent of last year's customers purchase again this year), you are in Retention Mode.
  • If you retain between forty and sixty percent of last year's customers, you are in Hybrid Mode.
  • If you retain less than forty percent of last year's customers, you are in Acquisition Mode.
Second, what do you customers do after they purchase from you?
  • Do they only purchase your products, brands or channels (called Isolation Mode)?
  • Do they like to try out other products, brands or channels (called Equilibrium Mode)?
  • Do they switch to other products, brands or channels (called Transfer Mode)?
  • Do they switch back and forth between products, brands or channels (called Oscillation Mode)?
The combination of modes determines the business strategy for a product, brand or channel.

Let's evaluate Circuit City, as an example. It is well documented that customers shop Circuit City via the online channel, then either purchase merchandise in-store, or purchase online and pick up product in the store.

Retail executives manage channels that have very different dynamics:
  • The retail channel frequently operates in Retention/Isolation Mode. In other words, last year's store customers purchase in-store again this year, and are not likely to shop other channels.
  • The online channel frequently operates in Acquisition/Transfer Mode. In other words, last year's online customers are unlikely to purchase online this year --- instead, the customer shifts purchasing to the store channel.
When business units operate under vastly different modes, leaders are needed to complement the mode of the business unit.

The leader of the online channel should be collaborative, one who does what is best for the total business. Her bonus structure should be based on her ability to facilitate customer purchases within any channel, not just her channel. The strategic development of her channel should be crafted around the natural behavior of her customer --- to shop in stores in the future.

The leader of the retail channel can be a different individual. Teamwork skills and collaboration may not be as important, because this individual has customers who are not likely to switch to the online channel --- and if the customer does switch, it is only to get information about retail merchandise.

Multichannel retailing is all about exploiting the strengths of each channel. It is not about "sameness", not about replicating the customer experience the same way in every channel.

This holds true for the leaders of each product, brand or channel.

In the Circuit City example, it may make sense to have a very experienced leader manage the online channel. This leader should be well versed at collaboration, consensus, humility, leading through others. This leader should be comfortable with not getting credit for all the good she does to make other leaders look good.

Conversely, it may make sense to have newer executives work in products, brands or channels that are in "isolation mode". In these instances, the leader has control over things, and has fewer moving parts to worry about.

All too often, we assign new leaders to smaller business units, business units with the least "risk". In reality, we should think about putting our most talented leaders in the most challenging roles. Those roles tend to happen in "equilibrium" or "transfer" mode.

Labels: , , , , , , , ,

January 18, 2007

Where Are Your Customers Going? Part Three Of Multichannel Forensics

If you didn't fall asleep during the first and second installments of my introduction to multichannel forensics, tonight's exploration may be a bit more intriguing.

Recall that we explored how repurchase rates determine how customers flow through your business.

Repurchase rates above sixty percent put you in 'Retention Mode'. Your business will grow from getting customers to purchase more often, and to add items to their purchases.

Repurchase rates between forty and sixty percent put you in 'Hybrid Mode'. These are fun businesses to run, because you can grow via customer acquisition, by getting customers to purchase more often, and by getting customers to add items to their purchases. Of course, customers have to want to purchase more often, or add items to their orders!

Repurchase rates under forty percent land you in 'Acquisition Mode'. These businesses require leaders who have a singular focus on finding new customers.

Yesterday, we talked about an example where catalog customers were migrating online. Today, let's see how catalog, online and retail customers behave.

Migration Probability Table


Catalog Online Retail


New Customers 3,442 9,350 5,937


Repurchase Rates


Corporate 57% 44% 49%
Catalog 29% 4% 3%
Online 35% 33% 5%
Retail 13% 14% 45%


Repurchase Indices


Catalog 51% 9% 6%
Online 61% 75% 10%
Retail 23% 32% 92%


Total Corporate Repurchase Rate = 46%


The repurchase indices are calculated as the repurchase rate divided by the corporate repurchase rate for that channel. Three primary modes, and one secondary mode appear. Let's look at our example.

Isolation Mode: This occurs when all of the repurchase indices are below twenty percent. This means customers are not likely to cross-shop any product, channels or brands. The retail channel is in Isolation Mode. Retail customers have a low catalog index (6%) and a low online index (10%). The retail index (92%) is not used.

Equilibrium Mode: This occurs when at least one repurchase index is above twenty percent, and no repurchase index is above fifty percent. The online channel is in this situation. The catalog index is 9%, so online customers do not cross-shop catalog. However, the retail index is 32%. This means online buyers are likely to cross-shop retail.

Transfer Mode: Executives leading businesses in transfer mode have problems. Transfer Mode occurs when at least one index is above 50%. Look at catalog. The index for retail is 23%, moving catalog to equilibrium mode. However, catalog moves to transfer mode with a 61% index for the online channel. Catalog customers are likely to cross-shop retail. Catalog customers move their loyalty to online.

The catalog executive is sunk. Her customers migrate online at dramatic rates. Her job is to facilitate this transition. She should not expect her business to grow.

The online executive has a mixed blessing. He is fed customers from the catalog channel, this helps grow his business. Notice that his channel is the number one source for new customers. This means he has that as a growth vehicle. However, his customers cross-shop retail.

Because retail operates in isolation (retail customers typically don't cross-shop online or catalog channels in this example), retail is likely to grow and be healthy. It gets customers from catalog, it gets customers from the online channel. Retail does not send customers to other channels.

Your homework assignment: For the products, brands or channels you are interested in, run the table illustrated above, and consider the dynamics surrounding your business. Where do customers come from, where do the migrate to, which products, brands or channels have the best potential for growth?

Once you learn these relationships, how might you alter your marketing strategy to capitalize on the natural flow of customer behavior that your business exhibits?

Labels: , , , , , ,

January 17, 2007

More On Loyal Customer Behavior Using Multichannel Forensics

Ok, you worked with your friendly programmer yesterday, and identified your overall company repurchase rate.

What was it? Sixty-three percent? If that's the case, your tend to have a loyal customer audience that is in 'Retention Mode'. When this happens, your business tends to grow by getting existing customers to purchase more often, and to purchase more items per trip. Anytime the annual repurchase rate is above sixty percent, your business is in 'Retention Mode'.

If the repurchase rate was between forty percent and sixty percent, you're in 'Hybrid Mode'. These business models are a lot of fun for executives to manage. You can grow by increasing the retention rate, by acquiring a lot of new customers, by increasing purchase frequency, or by adding items per trip.

If the repurchase rate was less than forty percent, you're in 'Acquisition Mode'. Your business will grow by a relentless quest for new customers.

Now that you have this metric for the whole business, your next step is to measure the repurchase rate for each product, brand or channel.

For instance, assume you are a multichannel retailer that has a catalog, online and retail channel. Your overall repurchase rate is fifty percent. Your overall business is in 'Hybrid Mode'.

Now, take one of your channels (i.e. catalog). Measure the repurchase rate for last year's catalog buyers, at a company level, and within each of your channels.

For instance, your catalog buyers might look like this:
*** Company Repurchase Rate For Catalog Buyers = 57%.
*** Catalog Repurchase Rate For Catalog Buyers = 29%.
*** Online Repurchase Rate For Catalog Buyers = 35%.
*** Retail Repurchase Rate For Catalog Buyers = 11%.

This tells a compelling story. Catalog buyers are loyal to the total company, in 'Hybrid Mode'. However, within the catalog channel, these buyers have a twenty-nine percent repurchase rate, putting them in 'Acquisition Mode'. These buyers tend to migrate to the online channel. To grow catalog, there must be a huge infusion of new catalog buyers. Online directly benefits by having a big catalog file of customers that migrate from catalog to the online channel.

Your homework assignment for tonight: Run the above table for every product, brand or channel you have. Tomorrow, we'll talk about the meaning of the individual percentages in the table above, and how to strategically understand the importance of those percentages.

Labels: , , , , , , ,

January 16, 2007

Measuring Loyal Customer Behavior Using Multichannel Forensics

How do you define whether your customer base is 'loyal' or not? If a customer purchased eight times at Wal-Mart last year, is the customer loyal? If a customer purchased eight times at H20Plus last year, is the customer loyal?

In reality, every business, even those with a poor management team, have very loyal customers. It becomes important to understand how customers behave over time.

The majority of businesses can measure customer loyalty over the course of a year. Management categorizes all customers who purchased during, say, 2005, and measures how many customers purchased again during 2006. This metric is called the 'repurchase rate', and is a very important metric for management to understand.

There are three modes that any corporation, product, brand or channel fall in to. They are:
  • Retention Mode: When sixty percent or more of last year's customers purchase again this year, your business is in Retention Mode. These businesses have loyal, repeat purchasers. Management can focus on increasing the purchase frequency of customers, as well as encouraging customers to purchase more items per order.
  • Hybrid Mode: When between forty percent and sixty percent of last year's customers purchase again this year, your business is in Hybrid Mode. These businesses are among the most enjoyable for executives to manage. They have a multitude of levers to pull to increase sales. It is possible for management to increase retention rates into Retention Mode. It is possible for management to increase purchase frequency, or to encourage customers to purchase more items per order.
  • Acquisition Mode: When less than forty percent of last year's customers purchase again this year, your business is in Acquisition Mode. This mode is surprisingly deceptive to executives, because it flies in the face of customer feedback. Management reads letters from loyal customers who love your product. Yet, the average customer is unlikely to purchase again next year. Management running businesses in Acquisition Mode have no choice but to continually find large sources of new customers to fuel future growth. Surprisingly, many web-based businesses that don't have the sku breadth of Amazon.com fall into Acquisition Mode. These businesses may struggle when the flow of customers transitioning from catalog businesses slow down over the next five years.
Your homework assignment is this: Talk to your resident programmer, and ask her to identify all customers who purchased in 2005. Of those customers, measure the percentage who purchased during 2006. Once you have that metric, identify which of the three modes your customer base falls into. We'll talk more about this tomorrow.

Labels: , , , , , , ,