Kevin Hillstrom: MineThatData

Exploring How Customers Interact With Advertising, Products, Brands, and Channels, using Multichannel Forensics.

September 15, 2008

Metrics That Matter

How many of you know how many of last year's customers will purchase again this year?

All the business intelligence pap about dashboard reports sells software. A few key metrics, metrics that I used to see printed out on green/white tractor paper back in 1991, will give you insight into where your business is heading. Let's review a few simple tables that many direct marketers produce.

This table analyzes existing customers. These were prior customers, acquired more than a year ago. For the 2008 row, these customers were acquired in 2006 or earlier, and placed at least one order during 2006.

Last Year Existing Buyer Performance


Households Rebuy Rate Spend/Rebuy Volume/HH Tot. Demand
2008 124,384 53.7% $274 $147.14 $18,301,613
2007 135,048 56.1% $283 $158.76 $21,440,626
2006 117,349 52.4% $249 $130.48 $15,311,228
2005 110,841 51.9% $208 $107.95 $11,965,508
2004 119,439 50.9% $203 $103.33 $12,341,274
2003 117,430 54.9% $201 $110.35 $12,958,283
2002 102,843 55.8% $200 $111.60 $11,477,279

This is direct marketing's version of "comp store sales". The marketer reviews the volume per household column, to understand if performance is improving over time. In this case, performance is down significantly in 2008, because the repurchase rate and spend levels are down. Also notice what happened back in 2005 --- metrics improved, but total demand decreased, because of a lack of file momentum coming out of 2004.

Direct marketers produce a table of this style for existing customers. A comparable table is produced for customers who were newly acquired in the prior year. This helps the direct marketer understand if newly acquired customers are holding up their end of the bargain.

Another table sums new and reactivated customers. Any customer who did not purchase in 2007, but purchased previously, and purchased during 2008, is included in the table, as are all new customers. The table looks something like this (each row replicating prior years).

New/Reactivated Buyer Performance


Households Rebuy Rate Spend/Rebuy Volume/HH Tot. Demand
2008 53,941 100.0% $188 $188.00 $10,140,908
2007 47,204 100.0% $215 $215.00 $10,148,860
2006 42,048 100.0% $203 $203.00 $8,535,744
2005 50,884 100.0% $189 $189.00 $9,617,076
2004 48,778 100.0% $185 $185.00 $9,023,930
2003 45,224 100.0% $183 $183.00 $8,275,992
2002 39,005 100.0% $180 $180.00 $7,020,900

In this table, we observe that 2008 hasn't been a bad year for new/reactivated buyers. Of course, your analysts will keep close watch on cost per new/reactivated customer, but from a dashboard standpoint, buyers are up, demand is down, yielding about the same amount of demand as last year.

These three tables tell the Executive an awful lot about the health of the brand. You can run the tables by channel or merchandise division if you wish. For many direct marketers, these metrics help diagnose the health of the business.

Labels:

July 28, 2008

Benchmarking Repurchase Rates

We enjoy comparing ourselves to others, don't we?

Now you might not be able to pull annual repurchase rate out of your web analytics or business intelligence solution. But you might be able to pull annual purchase frequency out of your information system.

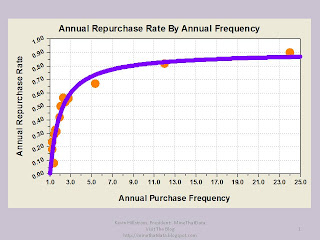
The attached graph indicates a relationship between annual purchase frequency, and annual repurchase rate. Annual repurchase rate is important, because it determines if you are in Acquisition Mode, Hybrid Mode, or Retention Mode. The mode you are in determines the type of business model you operate. It determines your sole purpose in life as a marketer.

If your customers order fewer than 1.75 times per year, it is most likely that your business is in Acquisition Mode. You retain fewer than 40% of last year's buyers. Your job is to constantly "fill the funnel" with new customers, or your business won't grow.

If your customers order between 1.75 and 3.00 times per year, it is most likely that your business is in Hybrid Mode, the most enjoyable mode for an executive to operate. You balance customer acquisition and customer retention activities.

If your customers order more than three times per year, it is most likely that your business is in Retention Mode. Roll out the loyalty program, because you have to find a way to increase annual purchase frequency --- you're not likely to move the annual repurchase rate much.

The table below allows you to identify if your annual repurchase rate is above or below average. Here are approximate averages, given annual purchase frequency (your mileage will vary depending upon your customer acquisition strategy and merchandise assortment).
  • 1.25 Annual Orders = 18% Annual Repurchase Rate
  • 1.50 Annual Orders = 30% Annual Repurchase Rate
  • 1.75 Annual Orders = 39% Annual Repurchase Rate
  • 2.00 Annual Orders = 45% Annual Repurchase Rate
  • 2.33 Annual Orders = 52% Annual Repurchase Rate
  • 2.67 Annual Orders = 57% Annual Repurchase Rate
  • 3.00 Annual Orders = 60% Annual Repurchase Rate
  • 3.50 Annual Orders = 65% Annual Repurchase Rate
  • 4.00 Annual Orders = 68% Annual Repurchase Rate
  • 5.00 Annual Orders = 73% Annual Repurchase Rate
  • 7.00 Annual Orders = 78% Annual Repurchase Rate
  • 10.00 Annual Orders = 82% Annual Repurchase Rate
  • 24.00 Annual Orders = 87% Annual Repurchase Rate.

Labels: , , ,

April 02, 2008

Brand Or Merchandise Loyalty In An E-Commerce Business

You have two merchandise lines that exhibit curious behavior.

Merchandise Line #1: Traffic is driven to the online channel from paid and natural search. Customers gobble up high margin merchandise, making the merchandise line one of your best sellers. There's only one problem ... these customers don't re-order from your business, implying that these customers have poor lifetime value.

Merchandise Line #2: Traffic comes from all advertising sources. Customers like this merchandise line at an average rate, and have an above-average repurchase rate, which implies that these customers have outstanding lifetime value.

You have money to spend on online advertising today, and your business is running below last year's sales levels ... not a good sign when managing an e-commerce business. Which merchandise line do you invest in?

Maybe you are already running reports that illustrate the purchase composition of the customers who buy each item you offer. I've seen several interesting iterations of this style of reporting. It's always a good idea to know if loyal customers, infrequent customers, or newbies are buying your merchandise ... and it's always a good idea to track the lifetime value of the customers each item draws into the business.

Labels: ,

May 10, 2007

Sharper Image And File Momentum

Sharper Image continues to deal with business challenges, according to Internet Retailer.

Multichannel Forensics sometimes illustrate business oddities. In some instances, merchandise problems can be fixed, and yet, sales will decrease.

For example:

  • Assume you start with 100,000 good customers.
  • Assume 30% of them repurchase.
  • Assume that each customer who repurchases spends $200.
  • Assume that you only get 40,000 new customers.
  • Assume that each new customer spends $100.
  • Total volume = 100,000*0.30*$200 + 40,000*$100 = $10,000,000.
  • Total customers = 70,000.
Assume you fix your merchandising woes. Next year looks like this:
  • We start with 70,000 good customers.
  • Assume 35% of them repurchase (an improvement over LY's 30% rate).
  • Assume that each customer who repurchases spends $200.
  • Assume that you get 45,000 new customers (an improvement over LY's 40,000).
  • Assume that each new customer spends $100.
  • Total volume = 70,000*0.35*$200 +50,000*$100 = $9,900,000.
In this example, you'd post a -1% comp store sales drop ... yet your internal customer metrics are all improved. Your repurchase rate increased from 30% to 35%. Your new customer acquisition counts improved from 40,000 to 45,000.

When businesses go bad, file momentum works against them. This example doesn't explain all the woes at Sharper Image. But the example demonstrates the critical importance of knowing all of your customer metrics. In particular, you need to know customer counts by segment, repurchase rates, spend per repurchaser, and similar metrics for new customer acquisition.

Your merchandising organization depends upon you to provide this service. On the surface, in this example, it looks like the merchants are failing again. In reality, file momentum is the issue --- merchandising of the store has improved.

Labels: , , , ,

January 17, 2007

More On Loyal Customer Behavior Using Multichannel Forensics

Ok, you worked with your friendly programmer yesterday, and identified your overall company repurchase rate.

What was it? Sixty-three percent? If that's the case, your tend to have a loyal customer audience that is in 'Retention Mode'. When this happens, your business tends to grow by getting existing customers to purchase more often, and to purchase more items per trip. Anytime the annual repurchase rate is above sixty percent, your business is in 'Retention Mode'.

If the repurchase rate was between forty percent and sixty percent, you're in 'Hybrid Mode'. These business models are a lot of fun for executives to manage. You can grow by increasing the retention rate, by acquiring a lot of new customers, by increasing purchase frequency, or by adding items per trip.

If the repurchase rate was less than forty percent, you're in 'Acquisition Mode'. Your business will grow by a relentless quest for new customers.

Now that you have this metric for the whole business, your next step is to measure the repurchase rate for each product, brand or channel.

For instance, assume you are a multichannel retailer that has a catalog, online and retail channel. Your overall repurchase rate is fifty percent. Your overall business is in 'Hybrid Mode'.

Now, take one of your channels (i.e. catalog). Measure the repurchase rate for last year's catalog buyers, at a company level, and within each of your channels.

For instance, your catalog buyers might look like this:
*** Company Repurchase Rate For Catalog Buyers = 57%.
*** Catalog Repurchase Rate For Catalog Buyers = 29%.
*** Online Repurchase Rate For Catalog Buyers = 35%.
*** Retail Repurchase Rate For Catalog Buyers = 11%.

This tells a compelling story. Catalog buyers are loyal to the total company, in 'Hybrid Mode'. However, within the catalog channel, these buyers have a twenty-nine percent repurchase rate, putting them in 'Acquisition Mode'. These buyers tend to migrate to the online channel. To grow catalog, there must be a huge infusion of new catalog buyers. Online directly benefits by having a big catalog file of customers that migrate from catalog to the online channel.

Your homework assignment for tonight: Run the above table for every product, brand or channel you have. Tomorrow, we'll talk about the meaning of the individual percentages in the table above, and how to strategically understand the importance of those percentages.

Labels: , , , , , , ,

January 16, 2007

Measuring Loyal Customer Behavior Using Multichannel Forensics

How do you define whether your customer base is 'loyal' or not? If a customer purchased eight times at Wal-Mart last year, is the customer loyal? If a customer purchased eight times at H20Plus last year, is the customer loyal?

In reality, every business, even those with a poor management team, have very loyal customers. It becomes important to understand how customers behave over time.

The majority of businesses can measure customer loyalty over the course of a year. Management categorizes all customers who purchased during, say, 2005, and measures how many customers purchased again during 2006. This metric is called the 'repurchase rate', and is a very important metric for management to understand.

There are three modes that any corporation, product, brand or channel fall in to. They are:
  • Retention Mode: When sixty percent or more of last year's customers purchase again this year, your business is in Retention Mode. These businesses have loyal, repeat purchasers. Management can focus on increasing the purchase frequency of customers, as well as encouraging customers to purchase more items per order.
  • Hybrid Mode: When between forty percent and sixty percent of last year's customers purchase again this year, your business is in Hybrid Mode. These businesses are among the most enjoyable for executives to manage. They have a multitude of levers to pull to increase sales. It is possible for management to increase retention rates into Retention Mode. It is possible for management to increase purchase frequency, or to encourage customers to purchase more items per order.
  • Acquisition Mode: When less than forty percent of last year's customers purchase again this year, your business is in Acquisition Mode. This mode is surprisingly deceptive to executives, because it flies in the face of customer feedback. Management reads letters from loyal customers who love your product. Yet, the average customer is unlikely to purchase again next year. Management running businesses in Acquisition Mode have no choice but to continually find large sources of new customers to fuel future growth. Surprisingly, many web-based businesses that don't have the sku breadth of Amazon.com fall into Acquisition Mode. These businesses may struggle when the flow of customers transitioning from catalog businesses slow down over the next five years.
Your homework assignment is this: Talk to your resident programmer, and ask her to identify all customers who purchased in 2005. Of those customers, measure the percentage who purchased during 2006. Once you have that metric, identify which of the three modes your customer base falls into. We'll talk more about this tomorrow.

Labels: , , , , , , ,