Kevin Hillstrom: MineThatData

Exploring How Customers Interact With Advertising, Products, Brands, and Channels, using Multichannel Forensics.

January 16, 2009

Lifetime Value And Organic Buyers
We're being asked to reduce marketing expense in 2009.

A current best practice is to calculate lifetime value. Customers with sufficient "LTV" receive outbound marketing, while customers with low "LTV" are not targeted with outbound marketing.

This year, the process is changing. We're being asked to not only forecast lifetime value, we're being asked to identify customers who experience lifetime value reductions because of our actions.

This sounds odd, but it really isn't an unusual concept. In the past, we'd identify a 13-24 month customer who loses $10.00 per order, and has $5.00 of LTV. This customer would be suppressed from subsequent campaigns because net LTV is -$5.00.

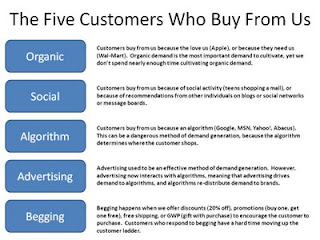
In 2009, we need to identify the customers who are likely to generate "organic demand" in the future. Amazingly, these customers can experience lifetime value reductions if we market to them, because the customer was going to purchase merchandise anyway.

The majority of CEOs working on Multichannel Forensics projects are asking me to identify organic customers. This is becoming an important part of the marketing process.

For the Statistical Modeler, this represents yet another "offshore drilling" opportunity --- a chance to work on something unique and new.

For the Catalog Marketer, this is a chance to reduce expense while not harming the top line.

For the E-Mail Marketer, this is a golden opportunity to reduce contacts to customers likely to order anyway.

And for the optimization whiz, go ahead and set up a bunch of marketing experiments. Testing is the best way to identify customers likely to generate organic demand!!

Labels: ,

July 08, 2008

Simple Tip: Customer Value By Day Of Week

Those of you who enjoy measuring long-term value might want to research customer behavior according to the day of week the customer purchases from your brand.

Retail customers purchasing on Saturday or Sunday have different future value than customers who purchase on a weekday afternoon or evening.

Online customers purchasing early in the week have different future value than customers who purchase evenings or weekends.

Catalog customers who buy during the in-home week have different future value than customers who buy two months after a catalog was mailed.

Those of you who analyze online visitation behavior will observe unique trends, based on the day/time the user visits your website.

Give it a try!

Labels: , , ,

April 02, 2008

Brand Or Merchandise Loyalty In An E-Commerce Business

You have two merchandise lines that exhibit curious behavior.

Merchandise Line #1: Traffic is driven to the online channel from paid and natural search. Customers gobble up high margin merchandise, making the merchandise line one of your best sellers. There's only one problem ... these customers don't re-order from your business, implying that these customers have poor lifetime value.

Merchandise Line #2: Traffic comes from all advertising sources. Customers like this merchandise line at an average rate, and have an above-average repurchase rate, which implies that these customers have outstanding lifetime value.

You have money to spend on online advertising today, and your business is running below last year's sales levels ... not a good sign when managing an e-commerce business. Which merchandise line do you invest in?

Maybe you are already running reports that illustrate the purchase composition of the customers who buy each item you offer. I've seen several interesting iterations of this style of reporting. It's always a good idea to know if loyal customers, infrequent customers, or newbies are buying your merchandise ... and it's always a good idea to track the lifetime value of the customers each item draws into the business.

Labels: ,

May 28, 2007

How Much Do I Spend On Online/Catalog Advertising?

Lands' End was a fun place to work in the early 1990s. There were a lot of interesting minds, tossing around interesting ideas.

One of our debates was about the optimal level of advertising spend. One camp, led by our Circulation Director, believed that you circulate to an incremental 7% pre-tax level (prior to subtracting fixed costs). The theory was that the return on investment had to be sufficient to cover fixed costs ... that if you actually subtracted fixed costs from the equation, you were circulating to about break-even.

Another camp believed that you circulated to -5% pre-tax levels, because this way, you were capturing long-term profit that you were losing in the short term. At the end of five or ten years, your business was much bigger, because you acquired/reactivated a lot more customers than in the situation where you maximized short-term profit.

At Eddie Bauer, we circulated to break-even (prior to subtracting fixed costs), then shifted our strategy to invest to below break-even, in order to maximize the long term health of the business.

At Nordstrom, we tried our hardest to convince folks to invest in online marketing activities that maximized the long term health of the total business. We probably under-invested in the online channel, though we had the data to tell us what the 'right' thing was to do. The process of assigning a marketing budget did not provide us the flexibility to maximize the online channel (and ultimately, to grow store sales). This is a good lesson --- it doesn't matter what data you have, there are internal processes and existing cultures that simply cannot be changed.

In the past, we didn't have the right tools to understand the long-term impact of short-term advertising decisions. With Multichannel Forensics readily available these days, we can simulate different strategies, and identify the best long-term strategy.

I crafted an online/catalog business simulation, and ran three scenarios.
  • Scenario #1 = Maximize profit each year.
  • Scenario #2 = Maximize total profit over the course of five years.
  • Scenario #3 = Maximize profit five years from now --- make that year as profitable as possible.
The table below show the results of the three simulations. All numbers are listed in millions:

Maximize Short-Term Profit

Demand Ad Spend Profit
Year 1 $44.6 $5.6 $2.1
Year 2 $42.0 $5.2 $1.7
Year 3 $40.9 $5.1 $1.4
Year 4 $40.4 $5.0 $1.2
Year 5 $40.1 $4.8 $1.1
Totals $208.0 $25.8 $7.4


Maximize Long-Term Profit

Demand Ad Spend Profit
Year 1 $59.2 $9.9 $1.5
Year 2 $66.6 $11.0 $2.0
Year 3 $70.6 $11.6 $2.3
Year 4 $72.8 $12.0 $2.4
Year 5 $74.0 $12.2 $2.4
Totals $343.2 $56.7 $10.6


Maximize Only 5th Year Profit

Demand Ad Spend Profit
Year 1 $66.4 $12.5 $0.6
Year 2 $80.3 $14.9 $1.6
Year 3 $88.6 $16.3 $2.2
Year 4 $93.4 $17.1 $2.5
Year 5 $96.3 $17.6 $2.6
Totals $425.0 $78.4 $9.5

Let's review each simulation.

In the first run, profit is maximized by year. Therefore, profit in the first year is $2.1 million. However, a much smaller business exists going into year two, with too few customers to generate large volumes of profit. Still, the management team tries to maximize profit in year two, then year three, year four, and year five. As a result, this business actually contracts. If we followed the rules of Wall St. (maximize short term profit), we may not protect the long term health of our business.

In the second case, online/catalog advertising spend is more than twice as much as in the first simulation. This means the business is more profitable in the long-term, and grows at a much faster rate.

In the third case, online/catalog advertising is fifty percent more than in the second case. This yields a marginally profitable business in year one, but in year five, the business is much larger, and more profitable.

For every online/catalog business, these scenarios can be easily created. The multichannel analyst provides management with three or more scenarios (as outlined above), and lets management determine the future trajectory of the business.

This is an important point --- abstract and geeky topics like lifetime value have little or no meaning to executives. Picking from one of three possible strategies is easy to do if you're an executive, and accomplishes the exact same thing as a geeky, technical lifetime value analysis.

Multichannel CEOs and CMOs: Simulations indicate that it is important to invest in unprofitable customer activities in the short term, in order to protect the long term health of your business. It is important not to focus on "this year". Where possible, invest in the short term, to protect the long term health of your business.

Labels: , , , , , , ,

May 20, 2007

Lifetime Value And Return On Investment (LTV, ROI)

Multichannel CEOs and CMOs: How do you make decisions that shape the future of your business?

Recently, the best and brightest analytical minds (David, Jim, Ron) lamented the fact that Lifetime Value is not a widely accepted business concept. The concept was re-branded as "Return On Customer", with (at best) marginal corporate acceptance.

Loosely defined, lifetime value is the present value of future profits. Lifetime value frequently appears in two different ways. First, analytical folks focus on an analytical and financial approach to managing the business. Second, brand marketers focus on advocacy of customer rights as a way of increasing long-term shareholder value. If we could only get these two audiences to work together (analytics/finance and brand marketers), we might have something!

In many cases, Lifetime Value is discussed from an "outside-in" perspective. In other words, somebody outside a company (vendor, consultant) is trying to persuade somebody within an organization to purchase services, without knowledge of the real needs of the person "inside" a business. This can give LTV a bad name.

From an "inside-out" standpoint, many companies indirectly measure Lifetime Value.
  • Catalogers are particularly good at measuring LTV, they manage list rental activities on the basis of LTV.
  • In many cases, the Web Analytics folks don't have the software tools to do LTV measurement. Yet, they indirectly know this is important, because they like to measure the behavior of "new verses existing" visitors.
  • Retailers often think of LTV in terms of "market share" or "most admired brand". Regardless whether this is flawed thinking or not, increased market share or being an admired brand deliver some of the benefits of a business with a customer base delivering outstanding LTV.
At some level, all companies and executives think about LTV. They just think about it differently than analytical folks, different than how the customer evangelist folks think about the problem.

Even better, let's get all the LTV evangelists together in a room, and let's see if they do things that are in the best interest of their own personal long-term health and financial benefit?
  • We smoke, or drink alcohol, or overeat, all things that reduce our lifespan.
  • We don't spend money in the best way. We purchase a Lexus or BMW or Mercedes that will depreciate from $60,000 to $0, when we could buy a Toyota Corolla. How does this decision help our own financial LTV?
  • We pay via credit card, then pay interest. How does that help our financial LTV?
  • We ignore health issues until they present dire consequences.
How can we expect "brands" to adopt LTV concepts when we don't take care of the LTV of our own financial or health concerns?

Like anything else in life, we know that LTV is good for us. All too often, we fail to follow through on what we know is good for us.

Based on my experiences working with business leaders, most would like to implement some version of LTV (they don't even know it is called LTV --- they just want a healthy long-term outlook that also generates lots of short-term profit). However, most Executives don't want the database marketing analyst hounding them about their thoughts and decisions.
  • LTV is risk-averse. LTV might suggest that Apple focus on their core competency of making computers & software, might suggest they not invest in an unproven MP3 player that requires a significant capital investment.
  • LTV tells you to invest in things that "work". Want to add new products to a catalog mailed to prospects? You can't, because new products probably don't have as good a LTV as existing products.
  • Want to invest in a new creative representation of your "brand". You can't. LTV tells you that the existing creative is what is liked most by customers.
  • Want to add a new catalog to your contact strategy? You can't, because LTV is telling you that you are over-saturating the mailing of your customers, lowering overall profitability.
  • Want to add a third e-mail to the weekly contact strategy? You can't, because LTV tells you that too many customers opt-out after receiving more than two e-mail campaigns a week.
  • Is your business in trouble, do you need to liquidate merchandise to open up your "open to buy"? Don't add a clearance catalog, because you'll lower the LTV of your full-price customers by converting them to full price + sale customers.
From time to time, LTV proponents struggle to see the business the way the Executive sees the business. Similarly, Executives make short-term decisions that mortgage or sub-optimize the long-term value of the business. Somewhere in-between these viewpoints represents the appropriate way to implement ROI-based decision-making within a business. That in-between place requires a culture that is willing to accept this thought process. Those cultures are hard to find.

Labels: , , ,

November 30, 2006

Return on Investment Formulas In Multichannel Retailing

Let's talk about some of the equations that individuals use to measure advertising return on investment in the multichannel retailing industry.

Ad to Sales Ratio: This is one of the most frequently used equations. Assume you spent $10,000 on an online marketing campaign, and generated $50,000 net sales. The ad to sales ratio is calculated as ($10,000 / $50,000) = 20%. Obviously, the lower this percentage is, the better your advertising performed. Multichannel retailers compare advertising efforts against each other with this metric.

Sales per Ad Dollar: Some industry publications like to use this metric. In the above example, we simply calculate the inverse of the ad to sales ratio. ($50,000 / $10,000) = 5.00. In this case, you get five dollars of sales for every dollar of advertising spent. The higher the metric, the better your advertising performed. E-Mail pundits like to use this measure, since e-mail has virtually no cost, thereby insuring that it has a good "return on investment".

Cost per Order: Online marketers enjoy using this metric, one that is maybe the least effective metric of all. Assume that the $10,000 spent in our previous examples generated 400 orders. Cost per Order (sometimes labeled "CPA" for cost per acquisition) is ($10,000 / 400) = $25.00. Each advertising strategy is compared, with lower metrics preferred. This metric is highly skewed, because the metric doesn't account for how much was spent, per order.

Profit per Order: A more effective, but less-used metric, is profit per order. Let's assume that, in the example above, twenty-five percent of the sales generated are converted to profit. In this case, ($50,000 * 0.25 - $10,000) = $2,500 of profit is generated. Next, divide the $2,500 profit by 400 orders. This yields $6.25 profit per order. This is one of the better ROI measures, because all aspects of the profit equation, sales, margin, and marketing cost, are included. Better yet, this measure can be stacked-up against long-term value metrics. For instance, if a marketer loses $10.00 profit per order, but expects to get $50.00 lifetime value back, the marketer should invest in the marketing activity.

Internal Rate of Return: This metric is not frequently used, but reflects what happens if marketing dollars are continuously invested over the course of a year. In the Profit per Order equation, we netted $2,500 profit on an investment of $10,000. Let's assume that this marketing effort took place over a twenty-six week period of time. The internal rate of return is calculated as ($12,500 / $10,000) ^ (52 / 26) = (1.25 ^ 2) = 1.56. In other words, on an annual basis, this investment has a fifty-six percent interest rate. The interest rate can be compared against all other marketing activities (many of which have a different time window --- e-mail may have just seven days, for example).

Your turn! What return on investment metrics do you like to use to evaluate marketing activities at your company?

Labels: , , , , , , , , , ,