Kevin Hillstrom: MineThatData

Exploring How Customers Interact With Advertising, Products, Brands, and Channels, using Multichannel Forensics.

March 11, 2009

Mega-Metrics: 12 Month Buyers
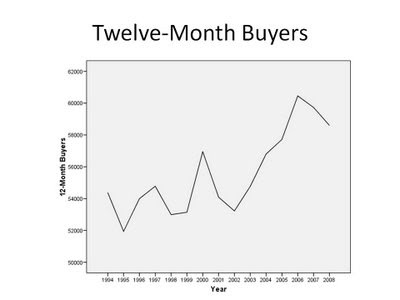
This week, we're going to explore some of the important metrics calculated in your garden-variety Multichannel Forensics analysis.

We start with the twelve month buyer file.

The metric is easy to calculate. Count the number of customers who purchased from your business in the past twelve months.

Next month, do the same exercise, and keep iterating through time.

Now graph the results.

The healthiest businesses do not grow by increasing spend per customer, or by increasing average order value. The healthiest businesses grow by continually increasing the number of customers who purchase in a twelve-month period of time.

I like to calculate several sub-metrics for the rolling twelve month buyer file. If I have, say, 50,000 twelve month buyers, I like to monitor the following:
  • The number of buyers who are existing (purchased last year, purchased prior to last year).
  • The number of buyers who are new (purchased last year, and are new to the file).
  • The number of buyers who were lapsed prior to the past twelve months.
The trends across these three metrics are so important to measure. Over time, you'll clearly get to see what it is that is driving growth in your customer file (hint, it is usually customer acquisition activities).

You can use this style of mega-metric for any business. E-mail marketers frequently keep track of twelve-month e-mail buyers, as well as e-mail twelve-month clickers, comparing to last month and last year.

This metric is a lagging metric --- in other words, it only tells you what has happened, it has no predictive power. But it is an important one to track. This metric is worth posting at the front door of your office building, for all employees to view and understand.

Labels: , ,

May 27, 2008

Great Moments In Database Marketing #8: The Rolling 12 Month File

The rolling twelve month file is one of the most under-utilized metrics in all of Database Marketing.

I was exposed to the metric in the early 1990s at Lands' End, after a few folks from Fingerhut made their way onto the Dodgeville campus.

The metric was put into use at Eddie Bauer in the mid 1990s. At the time, Eddie Bauer was a highly profitable brand, a brand going through an amazingly brisk retail transformation.

The rolling twelve month file is the "Dow Jones Industrial Index" of the Database Marketing world. It is a trailing indicator, telling you how many customers purchased from a product, brand, channel or store in the past twelve months. During times of change, the metric tells you what happened. It cannot tell you why something happened --- it is your job to figure out why!

We'd pick a market, say Omaha. Omaha did not have a retail store until the mid 1990s. We would measure how many customers purchased via the catalog, online, and retail channels in Omaha on a rolling twelve month basis.

When a store opened in a new market, the market was transformed. Catalog buyers decreased, online buyers flattened out, and retail buyer grew at a rapid rate. In other words, the new retail store was cannibalizing direct-to-consumer customers. And this is the way it generally works at brands that have a strong direct channel, then choose to add stores to the mix. Sure, you're now a multichannel brand, but the transformation comes with a cost.

In a new market, the rolling twelve month file for the retail store would stabilize within fifteen to eighteen month after a new store opened. After eighteen months, the market maintained a new balance between the channels, with each channel able to once again grow or thrive at the rate previous to the opening of the new store.

When you open a bunch of new stores, it is a good thing to conduct rolling twelve month file analysis for each market. The charts are also telling in saturated markets ... open a new store in a market that already has five stores, and watch what happens!

Any metric can be tabulated on a rolling twelve month basis. The key is to look for changes in the metric over time, then, dig into the data to understand why the metric is changing.

At Eddie Bauer, market saturation became obvious when viewing channels and stores through the rolling twelve month metric.


Hillstrom's Multichannel Secrets, Now Available!!
Support independent publishing: buy this book on Lulu.

Labels: ,

April 07, 2008

Micro-Channels

In an increasing number of Multichannel Forensics projects, the concept of micro-channels is becoming important.

Definition: A micro-channel is the combination of advertising channels and physical channels that are attributed to an order placed by a customer.

As you might surmise, most brands have a customer base using a diverse array of micro-channels. Micro-channels are ultimately driven by the customer, making them difficult to manage in a traditional marketing sense. Let's consider a series of micro-channels, for illustrative purposes:
  • Customer orders on a website using the key code from the back of the catalog.
  • Customer orders on a website after clicking on a paid search term. Customer received an e-mail campaign earlier that week, and received a catalog two weeks ago.
  • Customer visits website on Monday, then purchases merchandise in a store on Wednesday.
  • Customer sees a clearance item advertised on Twitter, visits website, purchases item.
  • Customer sees an item advertised on a popular apparel blog, visits website, purchases the item.
  • Customer receives a direct mail piece on Monday, visits website on Tuesday, buys merchandise in a store on Wednesday.
Our industry has an intense desire to parse mixed orders to the advertising channel responsible for generating the order. Once parsed, profit and loss statements are run for each advertising campaign within each advertising channel. This activity, while necessary, strips your database of a rich set of consumer behavior vital to the evolution of your brand.

My Multichannel Forensics projects suggest that micro-channels are highly predictive of future behavior, and help the brand go a long way toward determining when/if the customer should be advertised to.

Equally important is the concept of creating a micro-channel dashboard. In other words, rolling twelve month files can be created for each micro-channel. The dashboard illustrates the micro-channels that are growing, and shrinking.

In lieu of working with your favorite Multichannel Forensics expert, your matchback analytics vendor should be able to provide you with micro-channel reporting, especially if the vendor houses your customer database.

Labels: , ,