Mega-Metrics: 12 Month Buyers
 This week, we're going to explore some of the important metrics calculated in your garden-variety Multichannel Forensics analysis.
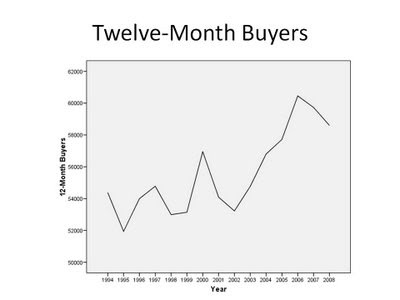
We start with the twelve month buyer file.
The metric is easy to calculate. Count the number of customers who purchased from your business in the past twelve months.
Next month, do the same exercise, and keep iterating through time.
Now graph the results.
The healthiest businesses do not grow by increasing spend per customer, or by increasing average order value. The healthiest businesses grow by continually increasing the number of customers who purchase in a twelve-month period of time.
I like to calculate several sub-metrics for the rolling twelve month buyer file. If I have, say, 50,000 twelve month buyers, I like to monitor the following:
- The number of buyers who are existing (purchased last year, purchased prior to last year).
- The number of buyers who are new (purchased last year, and are new to the file).
- The number of buyers who were lapsed prior to the past twelve months.
You can use this style of mega-metric for any business. E-mail marketers frequently keep track of twelve-month e-mail buyers, as well as e-mail twelve-month clickers, comparing to last month and last year.
This metric is a lagging metric --- in other words, it only tells you what has happened, it has no predictive power. But it is an important one to track. This metric is worth posting at the front door of your office building, for all employees to view and understand.
Labels: 12 Month Buyers, Rolling Twelve Month File, Twelve Month Buyers
6 Comments:
Great post. I've used ttm a bit in my history to get a real look at our shoppers, and also ho we functioned seasonally.
Thank you, Daniel. Good point on using metrics to detect seasonality!
What do you consider to be healthy growth for total 12-month customers?
Let's pretend, for a moment, that order frequency and price per item don't move. If that happens, then you need at least 3% growth in the customer file in order to cover increases in expenses due to inflation.
So a healthy business is likely to see 5% to 10% increases in the customer file.
This assumes that the business is mature (i.e. more than say 15 years old). Younger businesses are likely to experience faster growth in the customer file.
5-10% YOY growth or month-by-month growth?
Year-over-year growth ... you'll see all kinds of bizarre things happen month-to-month that can be explained by different marketing strategies.
Compare March 2009 to March 2008, and see if you have a healthy increase in file size.
Post a Comment
Links to this post:
Create a Link
<< Home