Kevin Hillstrom: MineThatData

Exploring How Customers Interact With Advertising, Products, Brands, and Channels, using Multichannel Forensics.

January 21, 2010

Planning: Forecast Accuracy

Ok, you've finally submitted your Annual Sales Plan for 2010. Now what?

It's time for forecast accuracy!

In e-commerce activities, I like to evaluate forecast accuracy on a monthly basis. In other words, each of your primary e-commerce micro-channels are evaluated against their forecast each month. You sum all Affiliate demand, and compare it against your forecast. You record the absolute value of your forecast error (-8% and +8% are both reset to 8%).

Repeat this process for all micro-channels (e-mail, paid search, natural search, each catalog you mailed last month). Calculate the absolute average forecast error (8%, 3%, 20%, 4%, 1% = 7.2%).

Your absolute average forecast error should be less than 8%. This is the number you evaluate your forecasting experts against. Each month, your absolute average forecast error should be less than 8%.

Now, here's the good part! After the first month is in the books, you are allowed to adjust your forecasts by advertising micro-channel. In other words, if e-mail marketing exceeded plan by 15%, and you have reason to believe that e-mail marketing will perform at 15% above forecast/plan for the rest of the year, go ahead and adjust your forecast. In subsequent months, you compare your forecasts to the revised forecast.

You'll find that your inventory team and your finance team will LOVE you if you get this part of the job done right!

In fact, you'll become THE person the company looks to, when wanting to know "what the future holds".

This is the best way, in my experience, for a garden variety analyst to gain Executive exposure. Simply own the forecast for where your business is heading, and you'll become an integral part of your Executive team, without having to deal with the pressures of being a real-life Executive.

Labels:

January 20, 2010

Planning: 5 Things To Avoid

As you've heard me say previously, Annual Sales Planning is a lost art.

For many of you, a new fiscal year begins on or around February 1. Your Finance department demands an air-tight financial forecast for the year.

Your job is to provide the air-tight financial forecast. Here are five things to avoid.

Avoid This: Do not put a "merchandise productivity" factor in your forecast. Just because the merchandising division believes that this year's assortment is "trend right" doesn't mean that you "put belief in the bank". Do not add a 5% factor to your forecast, or you are likely to miss plan, causing you to liquidate merchandise, causing you to miss your gross margin forecast, causing a lot of employees to not get bonuses, causing your business to be less profitable, potentially causing employees to lose their jobs.

Avoid This: Do not put a "conversion rate scalar" in your forecast. Just because you are working with a wizard who knows how to improve homepage or landing page conversion by 11.3% doesn't mean you are smart enough to forecast the improvement eight months ahead of time. Too often, improvements are "short lived", meaning that the customer becomes bored with the change, or the competition catches up with you, or you improve conversion rate but that only reduces visits (i.e. the customer would have purchased across two visits --- and now purchases in just one visit). Allow the changes to work, then "beat your plan", and let everybody look good.

Avoid This: Do not put a "creative factor" in your forecast. Your creative and marketing organization might feel strongly about their new initiatives. Never bank on these initiatives! How could anybody ever know if new imagery will result in a 4% sales increase, six months before the new imagery is to appear?

Avoid This: Do not put an "economic uptick factor" in your forecast. How the heck do you know that the economy will be 7.2% better in Fall 2010, compared with Fall 2009? Let people talk about this, but protect your company from buying inventory to cover a theoretical economic improvement that may never happen.

Avoid This: Do not put a "marketing improvement factor" in your forecast. How does anybody know that the October 6, 2010 e-mail marketing campaign is going to outperform a comparable campaign in 2009 by 13.4%? Focus on what you know, and what you know is how things performed last year.

I've seen entire profit and loss statements ruined, not because of customer productivity issues, but because of terrible planning assumptions that caused a company to over-buy merchandise, requiring markdowns and liquidations and gross margin erosion. Don't go there! Stick to the facts, please!

Labels:

January 19, 2010

Planning: Tops-Down and Bottoms-Up Approaches

There are two steps that happen in typical Sales Planning strategies.
  1. Tops-Down Sales Estimates.
  2. Bottoms-Up Sales Estimates.

The typical "Tops-Down" Sales Estimate is generated by a business leader. This person estimates what is likely to happen as strategies change.

The typical "Bottoms-Up" Sales Estimate is generated by a business analyst. This person is "in the trenches", generating a forecast from segment-level data, marketing campaign performance, key performance indicators, or customer projections.

The "Tops-Down" forecast and the "Bottoms-Up" forecast should be directionally similar. If they aren't, somebody must reconcile why the numbers are not directionally similar.

I tend to spend all of my time in the "Tops-Down" realm. My job is to create forecasts that are reasonable. So when a CEO wants to increase the marketing budget by 20%, I need to generate a reasonable sales increase to pair with the marketing increase.

When I don't have good data, I use a simple "square root" relationship to quantify my "Tops-Down" forecast. Let's say that we can attribute $20,000,000 to marketing efforts, and Management wants to increase marketing spend by 20% next year.

  • Tops-Down Forecast = $20,000,000 * (1.20 ^ 0.5) = $21,909,000.

I use the "square root" approximation because I want to discount the benefit of additional marketing spend. We seldom see cases where an incremental $1 investment in marketing yields an incremental $1 of sales. The "square root" approximation does a reasonable job of generating a "Tops-Down" forecast.

When the marketing analyst generates a sales forecast at a "Bottoms-Up" level, it should be directionally similar to the $21,909,000 estimate I generated. If I see $21,600,000, or $22,300,000, I feel confident that the analyst did a good job. If I see $24,000,000, I know that the analyst did something wrong --- there must be proof offered to demonstrate that a 20% increase in advertising will yield a forecasted 20% increase in demand.

These are the ways that "Tops-Down" and "Bottoms-Up" approaches reconcile to yield accurate sales forecasts. Ok, your turn. What methods do you use to reconcile sales forecasts?

Labels:

January 14, 2010

Planning: The Smell Test

When you are reviewing your sales plan for 2010, does it pass "the smell test"?

One of the first things you do when creating an annual sales plan is you build a sales forecast assuming that there are no changes in your advertising budget.

In other words, if all things are kept the same, what will the business look like in 2010?

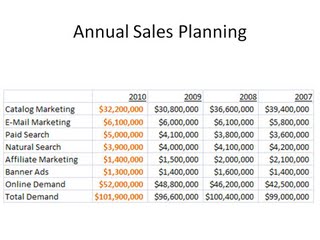
When you look at this table, are there any numbers that stand out, that don't look right, that don't pass "the smell test"?

Look at the catalog marketing number. Sales via the telephone (catalog marketing) have declined by ten or twenty percent, per year, for the past three years. And yet, the business leader that approved the forecast is projecting an increase in 2010. Just looking at the numbers, assuming no advertising changes whatsoever, what would you project for a catalog marketing number in 2010?

Look at the Paid Search number in 2010. In a case like this, one needs to challenge the marketing executive, asking for the facts that cause this number to increase. What is being executed, from a Paid Search standpoint, that causes the marketing executive to think that sales will increase this much without a change in advertising spend?

Look at Online Demand for 2010. Again, this appears to be a reasonable increase, but what are the underlying metrics that cause this to happen? Increased traffic? Improved conversion rate? The marketing executive must demonstrate that, without a change in advertising budget, these metrics tie out in a way that causes an increase in volume.

When planning sales for 2010, you first create a "base case", one that shows what happens to the business without any changes to the advertising budget. This forecast must pass "the smell test". Once it passes "the smell test", you may move forward with changes to the marketing plan.

Labels:

January 13, 2010

Planning: E-Mail Marketing

Annual Sales Planning is a lost art. In E-Mail Marketing, Annual Sales Planning is an art that was never crafted!

Here's the problem. Traditional E-Mail Marketing metrics (open rates, click-through rates, conversion rates) only measure what a customer does during a small window of time. So if an E-Mail Marketing program is delivered on a Monday, causing a customer to buy on Monday, but causes the customer to skip a purchase that would have happened on Thursday, you miss the lost sale on Thursday --- you only record the positive, you never record the negative.


That, my friends, is a problem. It means that you significantly overstate the importance of e-mail marketing.

Marketers avoid this problem by analyzing the results of mail and holdout groups. For instance, say you have an e-mail marketing list of 1,000,000 users. In each e-mail campaign, you mail 80% of the list, and you hold out 20% of the list.

(At this point, folks in the e-mail marketing community can be heard shrieking, as this goes against all established best practices).

We want a huge holdout group so that we can accurately measure what impact e-mail marketing has on other micro-channels. Does e-mail marketing help or hurt search marketing, for instance? I'd want to know that, wouldn't you?

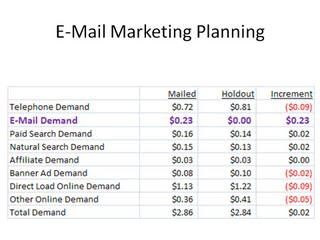
A typical mail/holdout result looks something like this:


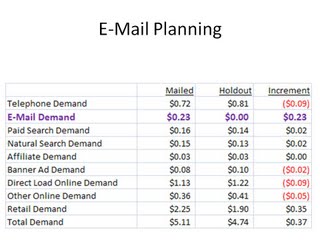
This table represents the secret that is obscured by traditional e-mail marketing metrics (open rate, click-through rate, conversion rate). Look at Telephone Demand --- if you send an e-mail marketing campaign, then Telephone Demand decreases. This means that the e-mail marketing campaign caused some customers to change their behavior, switching previously planned telephone orders to the e-mail channel.

E-Mail marketing generates $0.23 of demand ... this is what would typically be measured by e-mail marketing programs.

Now look at Paid and Natural Search. There are small increases. This means that e-mail marketing causes a customer to go out and search for information. Your e-mail marketing program may actually cause an increase in the Paid Search budget. Don't you want to know that, and budget for that accordingly?

Notice that e-mail marketing cannibalizes ordinary online channels.

In this example, e-mail marketing is estimated to generate $0.23 demand per customer --- but in reality, it is truly generating $0.02 demand per customer.

This is a common outcome among online brands and catalog brands.

For retail brands, we often see the opposite outcome.


Often, in retail, we see that e-mail marketing generates MORE demand than is measured via typical e-mail marketing analytics. Classic e-mail marketing fails to capture all of the incremental retail volume driven by e-mail marketing.

I find it fascinating that e-mail marketers don't ever talk about this --- their marketing programs generate tons of retail volume that they don't ever get credit for, and e-mail marketers don't seem to care about this.

CARE!

The modern Executive knows exactly what happens to every channel when e-mail marketing is increased, or withheld. The modern Executive uses this information in Annual Sales Planning, knowing that the information gives the leader tremendous strategic latitude. The modern Executive is not a slave to "comping what was done last year".

Labels:

January 12, 2010

Planning: Customer Retention

We're talking about Annual Sales Planning this month, a lost art in the e-commerce era. With most web analytics tools heavily focused on the tactics surrounding conversion, few people now focus on the strategic art of planning the future of a business.

Last week, we studied a business that was forecast to decline by 4.4%, due to having fewer good customers after a lackluster 2009. One way to grow the business is to dramatically ramp-up new customer acquisition. This can be an expensive proposition.

We can go through another exercise. Let's identify what has to happen in customer retention, in order for the business to be flat in 2010.

The cells in red are the ones that I changed. I increased customer retention rates by 6.1%, across the board. When I do this, the business is flat, year-over-year.

As an analyst, it is your job to communicate the productivity improvement needed to keep the business moving in the right direction. And if there isn't a marketing strategy that can improve retention by 6.1%, then it is up to the merchandising organization to sell product that is 6.1% more compelling than last year.

Do you understand how this style of analysis takes the pressure off of the marketing organization? The marketing analyst sets the table, communicating to all business leaders what is likely to happen if "all things remain constant". All Executives now know that there has to be a 19% increase in new customers, or a 6.1% increase in customer retention, in order for the business to just stay afloat.

Armed with this information, marketing outlines what it will do in order for the business to get closer to growth. The merchandising organization outlines what it will do in order for the business to get closer to growth. The e-commerce team outlines what it will do in order for the business to get closer to growth. All parties have a job to do, accountability can be assigned.

This is why we do Annual Sales Planning, a lost art in the era of e-commerce real-time software conversion analysis.

Labels:

January 06, 2010

Planning: New Customers

Annual Sales Planning is an important art, one that has been largely lost in the e-commerce era, as traditional web analytics packages focus on conversions, and not on actual customer behavior measured over time.

Strategically, we want to know what the future holds. We need to be able to react to business trends that are within our control.

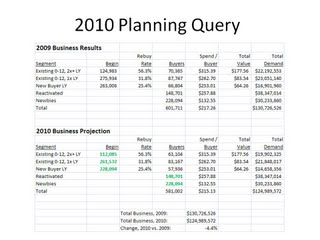
In this example, a soft 2009 yields a customer file that is likely to generate a 4.4% decrease in annual sales.

So, what can we do to get business back on track?

First, let's calculate how many new customers we need, in order for the business to be at the same size as last year. In this case, if I increase new customers from 228,094 to 271,500, the annual sales total is constant.

Now, given that new customers dropped from 263,006 to 228,094 from 2008 to 2009, there must be a valid strategy in place to cause new customers to increase to 271,500.

As an analyst, your job is to communicate to your CEO, CFO, and/or CMO what it would cost to acquire enough new customers to keep the business at a flat sales level. If that cost is prohibitive, then it is reasonable to assume that the business will decline.

Next up --- we'll look at what has to happen across customer retention metrics, in order to keep the business flat.

Labels:

January 05, 2010

Planning: An Overview

Please click on the image to make it bigger.

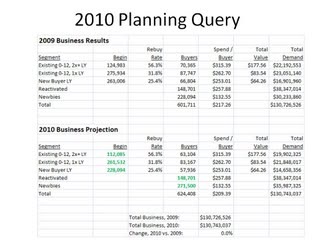
Annual Sales Planning is a lost art in the e-commerce era. In many cases, this happens because standard web analytics software applications are customized for conversion analysis --- the tools are not designed to answer strategic questions, instead, they are designed to answer important, tactical questions.

In other cases, this happens because nobody is teaching the craft of annual sales planning to a new generation of business leaders.

So let's do some teaching!

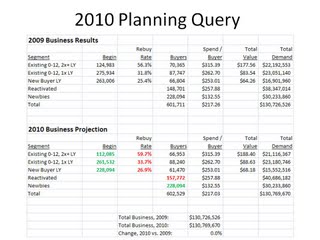
It's not terribly hard to construct the queries necessary to analyze the business. Pull all customers who purchased during 2008, and segment them into three groups ... those acquired prior to 2008 who purchased twice, those acquired prior to 2008 who purchased once, those acquired during 2008. Then, pull all customers who purchased during 2009 and not during 2008, split them into two groups --- those who had previously purchased, those who were new in 2009.

You now have five segments. For these five segments, calculate the percentage who purchased in 2009, calculate how much each purchaser spent, and then calculate total demand.

This set of queries yields the top half of the table. We can deconstruct where demand was generated for this $130,000,000 business.

Now, we run the exact same set of queries, but we adjust the date ranges by one year. This gives us the starting number of customers in the three existing customer segments. These three quantities are plugged in to the bottom portion of the table (color = green).

Finally, we have to plug in an estimate for how many reactivated customers we will have, and how many new customers we will have. For the purpose of this table, I assumed that the quantities will be the same as in 2009.

Plugging these values into the spreadsheet, I have a forecast for demand for 2010 ... $124.9 million is the forecast, a demand decline of 4.4%, assuming that everything in 2010 is the same as in 2009.

We'll stop the discussion here, for today. What we know is that, if things go the same way in 2010 as they went in 2009, the business will be 4.4% smaller in 2010. This is a metric that you must know, one that I routinely calculate for CEOs, CMOs, and CFOs.

Labels:

January 05, 2009

Modern Segmentation, Modeling, And Planning

Much of the segmentation/modeling/planning process involves predicting a future purchase, followed by the determination of an appropriate targeting strategy.

For instance, in this catalog example, we predict two things.
  1. We predict the Response Rate to a future catalog.
  2. We predict the Average Order Size for a segment being mailed a future catalog.
Based on these two predictions, and a forecast for the cost of mailing a catalog, we arrive at the following segment-level mailing prediction and profit/loss statement (after online/retail matchback):


Prediction
Response Rate 1.8%
Avg. Order $125.00
$ Per Book $2.25
Flow-Through % 35.0%
Flow-Through $ $0.79
Book Cost $0.70
Profit $0.09

The marketing world of 2009 requires a different level of sophistication.

In the future, we will change the planning and prediction process. This segment will be split into two sub-segments.
  1. Subsegment #1 = Customers with the same RFM-style classification, but never historically purchased using Paid Search, Affiliates, or Shopping Comparison Sites.
  2. Subsegment #2 = Customers with the same RFM-style classification, but historically purchased using Paid Search, Affiliates, or Shopping Comparison Sites.
In each case, we'll measure future response, but we'll also predict the expected marketing cost associated with self-service customers using Paid Search, Affiliates, or Shopping Comparison Sites. If the catalog or e-mail drives customers to these micro-channels, we incur additional marketing expense. Here's the sub-segment prediction:


Subseg #1
Subseg #2
Response Rate 1.8% 1.8%
Avg. Order $125.00 $125.00
$ Per Book $2.25 $2.25
Flow-Through % 35.0% 35.0%
Flow-Through $ $0.79 $0.79
Book Cost $0.70 $0.70
Pred. Search/Aff/SC Cost $0.02 $0.18
Profit $0.07 ($0.09)

In this example, Subsegment #2 generates additional expense, because they like to use Paid Search, Affiliates, and Shopping Comparison sites after receiving a catalog. Therefore, we have to predict what the amount of incremental expense is likely to be. The same level of prediction is required to properly manage future e-mail campaigns.

For Statistical Modelers, this opens up a whole new area of exploration --- it's like drilling for oil in areas where exploration was prohibited.

For the Catalog Circulation Director, this gives you the opportunity to fundamentally change the contact strategy for self-service online shoppers, while generating a boatload of profit for your brand.

For the E-Mail Marketer, you have a once-in-a-lifetime chance to motivate your Executive team to deliver e-mail campaigns to unprofitable customers less often --- and you'll have the proof!

For the vendor community, especially for matchback vendors, you have a whole new product you can develop --- one that integrates purchases and expenses in a holistic and actionable manner. Or maybe the folks at Coremetrics or Omniture can get a jump on the catalog vendor community, and take ownership of this new opportunity.

Best of all, all of you e-mail vendor employees who regularly read this blog have a chance to build an application that improves the profitability of e-mail marketing efforts for your clients --- a good thing!!!

Labels: , , ,