Kevin Hillstrom: MineThatData

Exploring How Customers Interact With Advertising, Products, Brands, and Channels, using Multichannel Forensics.

January 25, 2010

Online Marketing Simulations: Merchandise Growth

Open your spreadsheet (contact me for your copy), and take a look at cells J19 - N19.

Cells J15 - N27 illustrate simulated/projected growth in different merchandise divisions during the next five years. Remember, this is a business that is forecast to shrink significantly over the next five years.

But the merchandise division in cells J19 - N19 is forecast to grow!

In fact, this isn't the only merchandise division forecast to grow in the next five years. Look at J23 - N23.

When a business is struggling, there is often data available, data that shows the Executive a path to a profitable future. You just need the tools to demonstrate the profitable path to the future.

Click here to buy the book on Amazon.com ... or have me build an OMS spreadsheet for you by clicking here.

Labels: ,

January 11, 2010

Open Your Spreadsheets: Customer Quality

Time to open up your Online Marketing Simulation worksheets (click here to have me send you a copy, buy the book here).

In the spreadsheet, enter "0" in cells B101 - B188, and enter "0" in cells B190 - B580. This means that we are going to analyze just one segment of customers, a segment that is at a grade of "B" on an "A / B / C / D / F". Recall that I grade all customers in Online Marketing Simulations, so that I can measure where these customers migrate over time.

Ok, 7,062 customers with a grade of "B" don't stay as "B" customers for long, do they? At the end of five years, the majority of customers slump to grades of "D" and "F". In other words, good customers don't stay good customers forever. Here's what we see in our simulation:
  • Grade of A = 436.
  • Grade of B = 503.
  • Grade of C = 695.
  • Grade of D = 1,202.
  • Grade of F = 4,226.
Now, marketers think they can "fix" this problem. By initiating a loyalty program, or by simply dazzling the customer with outstanding marketing programs, we're told that marketers and vendors can "retain" your best customers.

So, let's assume that you can do a better job of retaining these customers. In cells C5 - G5, enter the value "1.30". This means that we're going to do a 30% better job of retaining customers, due to a loyalty program that does a spectacular job of retaining customers. What does the distribution of customers look like after five years?
  • Grade of A = 1,047.
  • Grade of B = 742.
  • Grade of C = 756.
  • Grade of D = 1,110.
  • Grade of F = 3,406.

If you can develop a loyalty program that somehow increases retention rates by 30% per year for each of five years, you can make a difference.

Good luck with that!

It is more common that new marketing efforts, as long as existing programs are being executed reasonably well, will lift retention rates by maybe 5%. So plug the value "1.05" into cells C5 - G5. Now take a look at how customers migrate over time:

  • Grade of A = 510.
  • Grade of B = 543.
  • Grade of C = 717.
  • Grade of D = 1,199.
  • Grade of F = 4,093.

Look at that! You improve retention rates by 5% a year, every year, and you basically get nowhere, do you? A 30% increase by year, every year, makes a significant difference, but is virtually impossible to achieve.

So, if you want to add an additional 500 customers at a Grade of "A", how are you going to do it? Your thoughts?

Labels: ,

January 04, 2010

Open Your Spreadsheets: Increased Advertising

Let's get overly simplistic here, but let's do so in order to prove a point. Open your spreadsheet! (contact me for a copy).

In the old days of cataloging, if you didn't advertise with a catalog, you didn't get sales. In the modern world of e-commerce, if you don't advertise, you still get sales. This is called the "organic percentage", the percentage of business that happens regardless whether you advertise or not.

Let's assume that 50% of the retention rate of existing customers happens regardless whether you advertise or not.

Now, let's say that you want to increase your overall advertising budget by 20%. In old-school marketing, there's a rule of thumb ... a 20% increase in advertising yields a 10% increase in business.

If half of the business is organic, then we can only impact the other half of the business with marketing. So a 20% increase in marketing to existing buyers yields a 10% increase in business on the half of the business impacted by advertising, yielding a 5% increase in volume.

So, open your spreadsheet, and look at demand over the next five years.
  • Year 1 = $75.9 million.
  • Year 2 = $70.4 million.
  • Year 3 = $66.7 million.
  • Year 4 = $64.4 million.
  • Year 5 = $62.9 million.

Now, let's increase the advertising budget for one year by 20%. We need to change cell C5 from 1.00 to 1.05. If we only change our advertising strategy for one year, we see the following outcome:

  • Year 1 = $79.0 million.
  • Year 2 = $72.0 million.
  • Year 3 = $67.8 million.
  • Year 4 = $65.1 million.
  • Year 5 = $63.4 million.

You get a $3.1 million dollar improvement in year one, and you get an additional $3.9 million in improvement in years two through five.

This is one of the things you simply cannot see with your standard web analytics package or sales attribution model or matchback algorithm.

Online Marketing Simulations can help you see the short-term and long-term impact of your marketing decisions. Don't you think your CEO (or CFO or CMO) wants to know this information? These are the kind of projects I routinely work on for CEOs, CFOs, and CMOs.

Exercise For You: Increase retention for five years by 5% ... type 1.05 into cells C5 - G5. What is the impact of spending more in advertising across five years?

Labels: ,

December 28, 2009

Empty Calories: Open Your Spreadsheets!

Pull out your spreadsheets, folks (e-mail me for a copy).

Please enter the value "0" in cells B101 - B580.

Now, enter the value "10,000" in cell B397. These are new customers that are acquired via low price points. In this simulation, we acquire 10,000 customers per year at low price points.

Next, enter the value "10,000" in cell B395. These are new customers that are acquired via higher price points. Look at how your new business evolves in a manner that is quite different than when you are exclusively acquiring customers from cell B397. You have far more "A" customers, you have customers who purchase at higher price points, you have a $3.8 million dollar business instead of a $2.8 million dollar business.

Direct marketing has become a game of promotions and discounts. We seek to optimize our business based on conversions, and in order to maximize conversions, we have to offer 20% off or free shipping or gifts with purchase or great deals on inexpensive items.

These two simulations illustrate how these "empty calories" impact the business, over time. We're much better off putting veggies in our bodies than snack foods and cookies.

Buy the book, Online Marketing Simulations, on Amazon.com!

Labels: ,

December 22, 2009

Change In Metrics: Open Your Spreadsheets!

Online Marketing Simulations are designed to illustrate to the marketer the long-term impact of short-term decisions.

So, let's open up our spreadsheets (e-mail me for your own copy).

Take a look at cells G10 - G25. This is the forecast for the business in Year 5, given current projections. Let's look at a few key cells.
  • G16, Orders per Buyer = 1.615.
  • G17, Items per Order = 2.424.
  • G18, Price per Item = $65.80.
  • G21, Customers With Grade Of 'A' = 58,417.

Now, let's make one small change. Let's assume that for just one year, in Year 1, customer retention improves by 20%. Enter the number 1.20 into cell C5. Now look at how all of the metrics change, in Year 5.

  • G16, Orders per Buyer = 1.629.
  • G17, Items per Order = 2.424.
  • G18, Price per Item = $66.58.
  • G21, Customers With Grade Of 'A' = 60,480.

Four years after the improvement, key metrics are, in many cases, changed.

Now, what do you think will happen to your business, long-term, when you give away the farm with free shipping and 25% off of every order?

Run your own Online Marketing Simulation to find out. Buy the book at Amazon.com!

Labels: ,

December 21, 2009

Customer Acquisition: Open Your Spreadsheets!

Let's run another simulation, one similar to the one we ran last week when evaluating customer loyalty.

Open your spreadsheets (e-mail me for your own copy). Using the customer acquisition index row (C6 - G6), enter increases in customer acquisition that yield a business that is generating $80,000,000 in sales in Year 5.

There are many solutions that get you to the same answer. Share your simulated results in the comments section of this post.

And if you want to purchase the book, click here!

Labels: ,

December 16, 2009

Customer Loyalty: Open Your Spreadsheets!

Here's one for those of you who have been following along with your own spreadsheet (e-mail me for your copy).

Quiz: Using the customer retention index line (cells C5 - G5), figure out how much you have to increase customer retention in order for this business to hit $80,000,000 in Year 5.

Use the comments section of this post to outline your solution. There are many different solutions that get you to the same answer.

Buy the book here, if you are so inclined!

Labels: ,

December 14, 2009

Inefficiency

The best reason to dig into Online Marketing Simulations (buy the book, purchase via Kindle, or buy a digital download) is to find inefficiencies in your business.

Here's the deal. The vast majority of online marketing focuses on "easy conversions".
  • SEO --- close to free.
  • E-Mail via batch-based campaigns --- close to free.
  • Promotions --- free shipping, % off, GWP, PWP.
  • Paid Search --- expensive, but better when coupled with a promotion.

There are what I call "hard conversions". These are the conversions that happen the old fashioned way, when a customer finds your product so compelling that they cannot resist it. Hard conversions often lead to loyal customers.

So the goal is to find hard conversions that lead to long-term value. That's not easy. But that's what the OMS methodology enables you to do.

See, you'd rather get half of the clicks if it means that those customers are worth double or triple the value of easy conversions, right?

I'm here to tell you that Online Marketing is inherently inefficient. The entire ecosystem, and the Web Analytics solutions that measure the ecosystem, create a giant feedback loop based on easy conversions. It's easy to see how the conversion funnel worked via Google Analytics.

Now try to use Google Analytics to measure the five year simulated trajectory of your business, based on the customers who fall through the purchase funnel and eventually convert. Or Omniture. Or Coremetrics.

We use Online Marketing Simulations to find inefficiencies, seeking to optimize the long-term health of our business. Those who use Online Marketing Simulations have a clear competitive advantage over those optimizing the business based on conversion rates.

Labels: ,

December 07, 2009

OMS and Ad Curves

By now you are using Online Marketing Simulations (book, kindle, digital download, contact me for a free spreadsheet, or hire me) to understand how customer behavior evolves over time. You are probably excited about some of the unique ways that customers behave, and you probably know a lot more about how to grow your business for long-term success.

Now, you probably want to know how much you should invest, in order to maximize your opportunity, right?

Here's where "Ad Curves" come into play. Click here for a brief article about Ad Curves.

When I am working with a CEO, CFO, or CMO, I combine the results of an Online Marketing Simulation with Ad Curves, yielding the optimal strategy necessary to yield profitable long-term success.

If you are managing e-mail marketing, paid search, or print marketing campaigns, you'll appreciate the insights gained by combining Online Marketing Simulations with Ad Curves!

Labels: , ,

December 02, 2009

OMS: Decomposing A Disaster

Time for everybody to pull out their sample OMS worksheets for an exercise (e-mail me for a copy)! And if you haven't secured your copy of Online Marketing Simulations (the book is a perfect Holiday stocking stuffer), you can buy the book via three sources:
  1. Via Amazon.com, $19.95.
  2. Via Amazon Kindle, $4.99.
  3. Via Digital Download at Lulu, $4.99.

Now, back to our regularly scheduled discussion. Open up your copy of the spreadsheet, and take a look at cells C18 - G18. What do you observe?

The average price that a customer is paying, per item, is decreasing over time. In fact, during the next five years, the average price trend is forecast to decrease by about 9%. This accounts for half of the reason why sales are dropping like a rock.

Look at cells C16 - G16. Even though prices are dropping, customers are not ordering more often. One might intuitively think that as prices drop, customers would become more "loyal", right?

Look at cells C17 - G17. Even though prices are dropping, customers are not ordering more items per order. One might intuitively think that as prices drop, customers would be willing to buy more items.

These are simple concepts ... prices, items, orders. And yet, combining simple concepts with Online Marketing Simulations allow you to see a forth-coming catastrophe.

So, I ask you the following question. Can you use Omniture, Coremetrics, Webtrends, Google Analytics, or any other software application to provide you with a five-year view of where your business is heading? If not, give me a holler!

Labels: ,

November 30, 2009

Ripple Effects and Cyber Monday

One of the reasons we run Online Marketing Simulations (Book, Kindle, Digital Download, Hire Me) is because we want to understand what I call "Ripple Effects".

We're all familiar with Ripple Effects, right? Our economy collapsed based on the actions of a relatively small number of players, folks who did things that rippled through our economy, one domino at a time.

You'll use Online Marketing Simulations to understand, for instance, how Cyber Monday discounts and promotions ripple through your customer ecosystem.

Say you offered customers 15% off plus free shipping during Cyber Monday 2008. You now have one year of data to plug into your simulation. You'll get to see how customers who took advantage of this generous promotion behaved.
  • Did these customers ever purchase full-price merchandise again?
  • Did these customers ever pay for shipping and handling again?
  • Did these customers ever purchase anything again?
  • Did you convert full-price customers to discount hounds?
  • Did you change the type of merchandise that the customer now prefers (i.e. low-price-point items)?

And you will get to see how changes in customer behavior ripple through your ecosystem. If your Cyber Monday promotions converted customers to low-price-point items in the future, then you'll see that high-price-point items are not selling as well, resulting in changes in merchandising strategy, changes that impact gross margin in the future, requiring more items to be sold, requiring more promotions to move items, further lowering gross margin ...

You get the picture!

You can simulate all of these things. You can plug in a smaller number of full-price buyers on Cyber Monday instead of a high number of promotional Cyber Monday buyers, and then see how this ripples through your business over the next five years. Pay close attention to the merchandise that sells in the future. Pay close attention to the discounts and promotions you'll have to give away in the future.

This is a great way to use an Online Marketing Simulation!

Labels: , ,

November 23, 2009

Optimizing Customer Acquisition

Buy the book on Amazon.com, or buy the Kindle version here. Finally, e-mail me for a copy of a free OMS spreadsheet so that you can follow along with our examples.

Ok folks, open up your spreadsheets. Take a look at the five year sales projection for this business.
  • Year 1 = $75.9 million.
  • Year 2 = $70.4 million.
  • Year 3 = $66.7 million.
  • Year 4 = $64.4 million.
  • Year 5 = $62.9 million.

Now let's try something different. Go down to the customer acquisition portion of the spreadsheet, and do the following:

  • Enter "0" into cell B452.
  • Enter "10,142" into cell B441.
  • Enter "11,463" into cell B443.

Look at the five year trajectory of this business:

  • Year 1 = $75.8 million.
  • Year 2 = $70.5 million.
  • Year 3 = $67.1 million.
  • Year 4 = $65.0 million.
  • Year 5 = $63.9 million.

This doesn't look like much of a difference, does it? Of course, we're only looking at changes to three of 240 different customer acquisition segments.

Here's the point I want to make. Those of us in the Web Analytics and Online Marketing community do everything possible to improve conversions today. This creates inefficiencies in our business. Use the OMS framework to understand the customer acquisition strategies that improve the health of your business long-term.

Think about being in this business five years from now ... having an extra million in demand might mean an additional $400,000 in profit, enough money to save five jobs.

All of these little details add up over time. When we optimize our business for today, we potentially cost ourselves our job in the future.

Labels: ,

November 16, 2009

A Laundry List Of Attributes

There's no reason that an Online Marketing Simulation (buy the book at Amazon.com or buy the Kindle version of the book) has to focus only on e-commerce purchase attributes.

For instance, here's a laundry list of attributes that are worth capturing:
  • Customer subscribes to e-mail campaigns.
  • Customer unsubscribes to e-mail campaigns.
  • Most recent e-mail campaign click-through date.
  • Customer only buys via free shipping.
  • Customer prefers expedited shipping.
  • Customer frequently abandons shopping cart.
  • Customer never abandons shopping cart.
  • Customer spends more than 15 minutes on your site.
  • Customer spends less than 15 seconds on your site.
  • Customer likes visiting clearance/sale pages/products.
  • Customer actually read your privacy statement (hint, pay attention to this).
  • Customer participated in live chat.
  • Customer clicked on Facebook or Twitter icon.
  • Customer generated a review of one of your products.
  • Customer volunteers demographic information.
  • Customer gave you contact information in an offline channel.
  • Customer who clicked on "contact us" link.
  • Customer watched one or more of your videos.
  • Customer is a proprietary credit customer.
  • Customer buys gift cards for others.
  • Customer redeems gift cards.
  • Customer clicked on your "careers" link.
  • Customer clicks on your store locator link.
  • Customer adds items to a "wish list".
  • Customer clicks on your "Espanol" link.
  • Customer returns merchandise.
  • Customer returns more than 2/3 of merchandise purchased and has purchased 3+ times (hint, stop marketing to this customer).
  • Customer purchased an extended warranty.
  • Customer asks to have product automatically sent to her on a monthly basis.
  • Customer utilizes rebates.
  • Customer shops by brands.
  • Customer shops by products.
  • Customer enlarges images.
  • Customer clicks on Top Sellers.
  • Customer clicks on a toolbar to share products via social media.
  • Customer clicks on "read reviews".
  • Customer abandons items rated at two or fewer stars on a 1-5 scale.
  • Customer uses site search function.

And on and on and on the list goes!

Take this information, and categorize the customer into one of forty segments, based on all of the information in the list. Combine the forty segments by five "grades" of productivity (A, B, C, D, F), and you have the perfect setup for an Online Marketing Simulation!

Labels: ,

November 11, 2009

Subtle Differences

Buy the book on Amazon.com, or buy the Kindle version here!

Time to open up your spreadsheets! (e-mail if you would like a copy).

Ok, enter the value "0.00" into cells C6 - G6. Next, enter the value "0.00" into cells B101 - B340. Finally, enter "1,000" into cell B189.

Next year, we'll retain 38.4% of these customers (cell C11). These customers will order 1.49 times (cell C16), buying 2.47 items per order (cell C17), paying $48.02 per item (cell C18). Notice that as time goes by, these customers become more loyal, buying more expensive items. By the end of year five, these customers are purchasing $83.00 items.

Now, enter "0.00" into cell B189. Enter "1,000" into cell B190.

Next year, we'll retain 36.8% of these customers (cell C11). So basically, these customers are very similar to the customers outlined earlier. However, these customers will order 1.6 times next year, buying 3.0 items per order, paying $40.89 per item.

In other words, these customers are subtly different --- about the same repurchase rate, but buying more items per order, and buying cheaper items as well.

Over time, these customers also buy more expensive items, but only spend $71.89 per item by year five. But notice that these customers are worth more in year five than the customers in the first segment (spending $77,000 in year five, vs. $57,000 in the other segment).

There are such subtle differences between customers in the businesses we manage. Our dashboards and reports suggest similarities. Over time, similar customers with subtle differences in purchase behavior diverge, becoming fundamentally different customers. When we optimize our business for short-term results, we miss out on the things that cause us to have a healthy business in the long-term.

Labels: ,

November 09, 2009

Firing Customers

E-mail me if you want a copy of the OMS spreadsheet to follow along with on our examples. Click here to buy the book on Amazon, or click here to purchase the book for your Kindle.

The concept of firing customers is a popular one. We read a lot of content that tells us to focus on the 20% of our customer base, the part of the customer base that generates most of the demand.

I'm not here to tell you that the strategy is right or wrong. I'm here to give you the tools to understand what it means to fire customers.

In our OMS spreadsheet, we grade customers with a grade of "A", "B", "C", "D", and "F". So today, we're going to attempt an experiment.

Open your spreadsheet. Notice the five year sales trajectory of this business.
  • Year 1 = $75.9 million.
  • Year 2 = $70.4 million.
  • Year 3 = $66.7 million.
  • Year 4 = $64.4 million.
  • Year 5 = $62.9 million.

Clearly, this business is in free fall. So, let's do something odd. Let's fire every customer with a grade of "D" or "F". These customers cannot purchase again, ever. We'll literally block them from buying from us. Any customer that falls into a grade of "D" or "F", during the next five years, is prevented from buying again in our simulation.

Enter the value "0.00" into cells C245 - C340. This means that customers with a grade of "D" or "F" cannot buy again. We'll keep acquiring new customers. Take a look at the results.

  • Year 1 = $73.4 million.
  • Year 2 = $66.1 million.
  • Year 3 = $60.4 million.
  • Year 4 = $56.1 million.
  • Year 5 = $52.9 million.

In the first year, firing customers has almost no impact on sales ... sales decrease from $75.9 million to $73.4 million.

In the fifth year of the simulation, firing customers has a significant impact on sales ... sales decrease from $62.9 million to $52.9 million.

Your job is to determine if this type of decision increases profit, or decreases profit. My job is to show you that there is a cumulative impact that results from the decisions we make today. So many of us in the Web Analytics community and Online Marketing community look to optimize conversion rate, seeking to optimize the performance of the business today.

Hint: The Online Marketing world is "inefficient". When everybody is trying to optimize short-term results, you gain a competitive advantage by optimizing long-term performance. Use the OMS framework to do this!!

Labels: ,

November 08, 2009

Digital Download Now Available: Online Marketing Simulations

Oh sure, I can offer merchandise across multiple channels!

You can buy the book on Amazon.com, $19.95 --- click here.

You can buy the Kindle version via Amazon, $4.99 --- click here.

And now, you can purchase a digital download of the new book for $4.99 via Lulu.com --- click here.

If you are a "best customer", you'll purchase this book in multiple channels, right? I mean, multichannel customers are the best customers, so that means you'll probably purchase multiple copies in multiple channels!


Labels: ,

November 04, 2009

Different Customers, Different Behaviors

Online Marketing Simulations (buy the book on Amazon.com) routinely show us that different customers exhibit different behaviors.

Go to the sample spreadsheet (
e-mail me for a copy), and do the following:
  • Enter 0.00 in C6 - G6.
  • Zero-out cells B149 - B340.

Here, we're running a simulation, evaluating only how customers with a Grade = A (the very best customers) perform over time. Play close attention to cells J5 - N7, these cells represent the sales trajectory of best customers across three advertising channels.

Don't save these results. Close the spreadsheet, then open it again, and do the following.

  • Enter 0.00 in C6 - G6.
  • Zero-out cells B101 - B292

Here, we're running a simulation, evaluating only how customers with a Grade = F (the most marginal customers in your database) perform over time. Look at cells J5 - N7. What do you observe? Well, Channel 2 gets disproportionately more sales, while Channel 3 gets disproportionately less sales.

This happens in your business too, folks. You will see that your best customers have purchase preferences that are different than are the preferences of marginal customers.

Use this information to your advantage. Know which marketing channels appeal to best customers, and to marginal customers!

Labels: ,

November 02, 2009

Paid Search: Low Long-Term Value?

Get your copy of Online Marketing Simulations via Amazon.com.

Paid Search is an absolute enigma, folks.

Talk to online marketing experts, and it is truly a big deal, the primary way many online brands acquire new customers.

Talk to offline marketing experts, and you hear a common theme ... "paid search customers have poor long-term value."

Long-term value is a relative term, comprised of two components ... "involuntary expense", and "voluntary expense".

Voluntary Expense includes all outbound direct marketing expenses that work for/against long-term value. Catalog marketers often begin to send paid search customers a veritable plethora of catalogs. If the paid search customer has no interest in catalog marketing, long-term value is going to decline, rapidly. The marketer is making a voluntary choice to speak with the customer, impacting long-term value.

Involuntary Expense happens after the customer is acquired. If a paid search customer elects to use paid search in the future, the brand experiences "involuntary expense". Sure, the brand could choose to not participate in paid search, but if the brand does participate, expenses are rung up in an involuntary manner, essentially controlled by the customer.

Marketing Executives use Online Marketing Simulations to understand how the customer is likely to migrate and change in the future. Simply isolate the paid search customer, and then see which channels the customer is likely to purchase from over the next five years. You can literally tally-up the offline advertising expense you'll incur, and the paid search expense you'll incur.

If you find that paid search customers are unprofitable, eliminate voluntary expense (i.e. offline direct marketing that you control). You may find that paid search customers have low long-term value only because they don't want to be marketed to with offline direct marketing activities. You may also find that paid search customers who purchase specific items have lower long-term value, or that non-branded terms have lower long-term value, as an FYI.

For those of us managing businesses where we do a lot of outbound marketing (post cards, catalogs, e-mail), long-term value is controllable. It is perfectly acceptable to acquire a paid search buyer that generates $5 of long-term value, and it is perfectly acceptable to acquire a customer via postcard marketing that generates $50 of long-term value. It is how we manage the long-term value that matters! Heck, let's go find ten of the paid search buyers and just deal with the subsequent value difference.

Most important, use Online Marketing Simulations to understand the long-term value of all customers from all advertising micro-channels!

Labels: ,

November 01, 2009

Kindle Version of Online Marketing Simulations is Available

Good news for those of you who are into reading books on your Kindle ... Online Marketing Simulations is now available in Kindle format!

Click Here For Paperback Version ... $19.95.

Click Here For Kindle Version ... $4.99.

By the way, loyal blog readers, the Twitter audience is drubbing you in sales totals ... by a factor of nearly 4 to 1. Are you going to stand for this? Are you going to let the Twitterati run circles around you? Or are you going make the technological leap and be competitive and buy this book? I mean, I've been brazen in my claims that you cannot sell anything on Twitter, and yet this book is selling so much better among the analytical types following on Twitter than among this audience. Oh boy!

Also interesting is the fact that the book, in the very early stages, is being embraced by the online vendor community, in fact, it's a bit of a surprise to me. I strongly feel that the methodology should be part of online marketing software tools.

Thanks to all of you who made the debut of the book the 9,500th best selling book on Amazon last Wednesday, I appreciate it! That's quite a feat for a self-published book with no marketing behind it whatsoever.

Labels: ,

October 28, 2009

Dear E-Mail Marketers: E-Mail Is Dead, Huh?

Dear E-Mail Marketers:

You represent a fun niche. The leading pundits have declared your medium "dead", less than two decades after being formally launched. You now join catalog marketers in the direct marketing graveyard.

Sure, your niche is still highly profitable. Pundits, however, don't care about profitability. They care about "what's next".

Companies, however, care an awful lot about profitability. It turns out that companies cannot stay in business unless they generate a lot of profit.

Maybe it is time for e-mail marketers to finally prove that e-mail marketing generates long-term profit.

Carefully review your Online Marketing Simulations (buy the book here on Amazon.com, the 9,500th best selling book on Amazon yesterday!), paying specific attention to what customers who purchase from the e-mail advertising micro-channel "do next".

Often, you'll find that e-mail drives future sales increases in other channels. You'll notice that e-mail customers become paid search buyers, or respond to offline ads, or become so loyal that they no longer require advertising to purchase in the future. Heck, in a lot of my projects, I can prove that Google absolutely loves e-mail marketing --- e-mail causes a purchase to happen, and then customer behavior changes, resulting in future paid searches. In other words, your e-mail marketing activities fuel future success for Google.

Use your simulations to analyze the long-term value of the social media shopper, and compare it with the simulated long-term value of the e-mail customer. Seriously. Do it! Tell the world what you find!

E-Mail marketers, once you have the data to defend your channel, defend it!!! It's not going to be good enough to say that e-mail is a relationship builder, or is the glue that holds marketing together, or is the tactic that feeds social media activities. Prove the value of your channel, demonstrating the value via long-term sales and profit. Show what happens to a business if e-mail marketing doesn't exist. This is one of the best applications of an Online Marketing Simulation.

Dear e-mail marketers. Buy the book. Apply the techniques outlined in the book. And then prove to people the profit your discipline contributes to your business.

Labels: ,

Amazon.com Is Now Offering Online Marketing Simulations!!

Well, that happened 10 days faster than it was supposed to happen.

You can now purchase Online Marketing Simulations at Amazon.com --- click here for more details.

Click here to search inside the book, to see the table of contents and a few tidbits.

And if you're waiting for the Kindle version of the book, it will be ready shortly, available for $4.99.

Read the book. Create your own spreadsheet. Apply the concepts to your business. Be a sage, be one of the only people in your company who knows whether your business is forecast to grow indefinitely, or is heading toward a problem.

If you are particularly "geeky", you'll enjoy the 50-ish pages of computer code at the back of the book.

If you're a CEO, you must have this information. Every CEO must know where business is heading, and must be ready to mitigate negative outcomes.

If you are a Marketing Executive, you will be light years ahead of your competition by having the outcome of an Online Marketing Simulation.

These are the projects that CEOs are hiring me to perform these days, so buy the book, and get busy on your own OMS project!!

Labels: ,

October 26, 2009

The Pre-Release of Online Marketing Simulations!!!

I am so excited!!

Click here to purchase my new book, Online Marketing Simulations. The book is being pre-released via my publishing platform --- so if you are dying to have the book, you can buy it today via Createspace for the same $19.95 fee that you'll be able to purchase it for on Amazon.com in two weeks, plus a shipping/handling fee.

Because you are a loyal blog reader, you get access to the content two weeks before the general public!

About fifteen years of intense customer research have gone into the creation of this industry-leading methodology.

This handbook walks you through an e-commerce online marketing simulation. You'll get to explore the ways that customers of different levels of quality, merchandise preference, and online advertising micro-channels (Affiliates, Offline Ads, E-Mail, Social Media, Print Ads, Search, No Attributed Source) all interact with each other. You will clearly see the "MVP", or "Most Valuable Path" that a customer takes as the customer migrates from first purchase to loyal shopper.

Most important, you will learn how to optimize your online business for long-term success. Current web analytics software applications fail to provide you with a five year sales forecast by advertising micro-channel / merchandise division. The Online Marketing Simulation allows you to play "what-if" games, identifying the optimal strategy for long-term success.

And if you don't think you'll be in your job 24 months from now, then Online Marketing Simulations allow you to optimize your business for the next twelve months, so that you can earn a nice bonus!

Here's what you get when you purchase this book. There are plenty of geeky details, and plenty of high-level strategy appropriate for a CEO, CMO, or CFO.

  • 106 pages of examples that illustrate how to execute Online Marketing Simulations.
  • A companion spreadsheet to work through examples and use in your projects.
  • 51 examples and accompanying tables.
  • More than 50 pages of programming code, so that you can populate your own spreadsheet.
  • 162 pages, total.

Who should buy this book?

  • CEOs looking to predict where e-commerce sales are headed over the next five years.
  • CMOs trying to allocate marketing dollars across advertising channels.
  • Vendors looking to add important functionality to their software suite.
  • Online Marketing Executives trying to demonstrate the value of each advertising channel.
  • Web Analytics Experts, especially those looking to obtain skills necessary to analyze the entire business, not just the online channel.
  • Business Intelligence mavens with an interest in simulating future activity.

I'm so excited that it is finally available!!!!!!! Help spread the word!

Labels: ,

October 21, 2009

OMS: Compound Interest

Please send me an e-mail message if you'd like a copy of the spreadsheet to follow along with.

Old-school direct marketers like to explore the concept of Lifetime Value.

In online marketing, however, the focus is generally on conversion rate, on getting customers to purchase something today, now!

So go ahead and obtain every single conversion you can. You can't argue that it generates sales today!

Now that you have a bunch of new customers, let's try something. Enter "0.00" in cells D6 - G6. Then enter "0.00" in cells B101 - B340. In this situation, you are acquiring new customers in year one, and then you're following them (and only them) for the next four years.

What did you learn?

Well, these customers generated $13.3 million in the year you acquired the customer.

But now take a look at the compound interest you earned ... $6.7 million in year two, $5.9 million in year three, $4.8 million in year four, and $3.9 million in year five.

You could roll this out into infinity if you wanted to.

In the subsequent four years, these customers generated $21.3 million.

Customers acquired in one year don't act like compound interest. But when you keep acquiring new customers, year after year after year, the result is like compound interest.

You think about your conversion activities differently when you realize that the customers you acquire today will spend 1.6 times as much over the next four years. By balancing short-term and long-term profit, you optimize your online business for long-term success.

Labels: ,

October 19, 2009

The New OMS Book: One Week Away!

We're closing in on the release of my new book on OMS, aptly titled 'Online Marketing Simulations'!

This book is written for CEOs, CMOs, Online Marketing Directors, Online Marketing Managers, and Web Analytics Experts looking to understand how to optimize the long-term health of a business.

This book is paired with a companion spreadsheet (the url for the spreadsheet is listed in the book). The spreadsheet outlines an online business with the following advertising micro-channels:
  • Affiliates.
  • Offline Advertisements.
  • E-Mail Campaigns.
  • Social Media.
  • Print Ads.
  • Search.
  • No Attributed Source.

The spreadsheet also contains five merchandise divisions. Think of these as being similar to the tabs running across the top of an e-commerce website. In total, there are five customer grades (A, B, C, D, and F) with eight online advertising micro-channels (all channels + multiple channels) and six merchandising divisions (five + multiple merchandise divisions) yielding 240 segment combinations.

Most important, you will get to see how you can identify a "MVP", or "Most Valuable Path", the route that customers take from acquisition to loyalty. It is my opinion that identification of the "MVP" is more important to the long-term health of your business than is optimization of conversion rate.

The book walks you through an analysis of a business, helping you understand what steps you can take to make sure that, in five years, your business is growing at the rate you want for it to grow. If you are a CEO or CMO, you need to know how your actions impact the future of your business.

If you are an SPSS/SAS programmer, or you use another programming language, then you'll appreciate the 50+ pages of programming code in the appendix. With this information and the spreadsheet, you will be able to create your own Online Marketing Simulation.

I am self-publishing this book via Amazon, and am offering the book at a reasonable $19.95 price point. The book is clean and simple, no fancy colors or fonts or graphics, it simply offers a soup-to-nuts approach to conducting an Online Marketing Simulation.

I sincerely believe that Online Marketing Simulations should be part of any web analytics software package. After you purchase the book (or read the posts on this blog), if you feel the same way, let our web analytics software provider know that you want to see Online Marketing Simulations incorporated in their software offering.

OMS projects and Multichannel Forensics work will be the focus of my consulting work over the course of the next year --- these are things that CEOs are asking me to do for them. So give the book a chance when it becomes available next week!

Labels: ,

OMS: You Shape The Direction Of Your Brand

Please send me an e-mail message if you'd like for me to send you a copy of the OMS spreadsheet to follow along with our posts.

Do you ever feel like you don't make a difference?

Maybe you are the humble paid search analyst at your company, and your CEO wonders what you're doing with all of those confusing keywords.

Maybe you just had a breakthrough --- you've found one set of keywords that, coupled with outstanding merchandise, cause a breakthrough in conversion rate.

Can you prove your worth to your CEO?

Go to the OMS spreadsheet. Take a look at cells N15 - N27. These are the annual demand totals for each merchandise division five years from now.

Now try this. Go to cell B39, and instead of the value 3,599 that is in that cell, change the cell to "6,599". In other words, you are adding 3,000 new customers, over each of the next five years, to the business, because you did such a great job of finding a set of keywords that, coupled with outstanding merchandise, cause a breakthrough in conversion rate.

Now look at cells N15 - N27. How did the cells differ?

Well, you've increased the value of your business over time, haven't you? Look at merchandise divisions 14 and 21.
  • Division 14 Old Value = $8.9 million. New Value = $9.3 million.
  • Division 21 Old Value = $1.17 million. New Value = $1.23 million.

Each division experienced increases of more than 4%, just from a subtle change in keyword strategy across a few merchandise divisions. Also notice that all merchandise divisions generated some benefit, as customers spilled-over, during the course of five years, from divisions 14 and 21 into other divisions. In year five, the business is $800,000 bigger because of the efforts of one individual, making one or two subtle changes today.

Every online marketing professional is making small improvements, improvements that have long-term consequences. As an industry, we do a terrible job of demonstrating our value, on a long-term basis.

The CEO uses the Online Marketing Simulation environment to understand the value all employees bring to the table. Once we get to see that value, illustrated over time, we make different decisions in the short-term to capitalize on it. Online marketing is taken in a new direction, a more productive direction.

Labels: ,

October 14, 2009

OMS: Cross-Selling and Up-Selling

Please send me an e-mail message if you'd like to follow along with your own copy of a sample OMS spreadsheet, or if you're looking to work with me on an OMS project.

We read a lot about cross-selling and up-selling merchandise, and for good reason. There's nothing more fun, from the standpoint of a merchant, than adding another item to an order, generating an additional $20 of profit for almost no additional work.

Now, let me ask you a question: Does customer value increase if a customer adds a cross-sell or up-sell item to their order?

Go into the OMS spreadsheet, and type the value "1.05" into cell C7. Look at the demand values for the next five years:
  • Year 1 = $79.7 million.
  • Year 2 = $70.5 million.
  • Year 3 = $66.7 million.
  • Year 4 = $64.4 million.
  • Year 5 = $62.9 million.

Next, type "1.00" into cell C7. Next, type the number "1.05" into cells C5 and C6. Look at the demand values for the next five years:

  • Year 1 = $79.7 million.
  • Year 2 = $72.3 million.
  • Year 3 = $68.1 million.
  • Year 4 = $65.3 million.
  • Year 5 = $63.6 million.

Do you notice the difference?

Getting customers to spend 5% more in one year has the potential to benefit one year.

Increasing customer response by 5% pays us downstream benefits ... in this case, an additional $4.8 million over the next four years.

Carefully analyze the customers who purchase cross-sell and up-sell items, comparing them against customers who have identical characteristics but have not been swayed by cross-sell and up-sell items. Measure the long-term benefit your programs deliver ... are you fundamentally changing customer behavior, or are you enjoying the benefits of short-term profit generation?

Labels: ,

October 12, 2009

Breaking News: A New Book!!!!

In just a few weeks, you will be among the first to have the opportunity to purchase a new book:
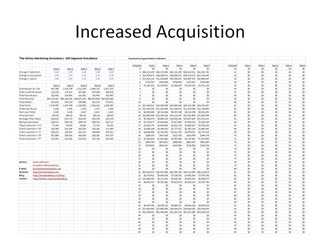
Online Marketing Simulations: The Definitive Methodology For Predicting The Future Of Your Online Business

The book walks you through an example of an e-commerce business with the following characteristics:

  • Seven Advertising Micro-Channels, including Affiliates, E-Mail, Offline Advertising, Print Ads, Paid Search, Social Media, No Defined Source.
  • Five Merchandise Divisions.
  • 240 Analysis Segments.
  • Free Spreadsheet, downloadable from http://minethatdata.com/, to use as you walk through the exercises in the book.
  • SPSS Computer Code required to build the spreadsheet from scratch --- more than 4,000 lines of programming code will be available. If you're an enterprising coder, you'll be able to recognize what I'm doing, allowing you to code the entire simulation in the programming language of your choice.

Within this framework, you will explore all of the ways that Online Marketing Simulations can be used to learn which customers have the best long-term value, allowing you to optimize your marketing campaigns in the short-term for better results. You will also get to see how a business can be calibrated for long-term growth.

The book will be available on Amazon.com. And I listened to you, I heard your concerns about how much a business book should cost. So this time, the price is tentatively set for $19.90. You will be hard-pressed to find content of this nature available anywhere else, much less at that price. Management Consultants might charge a hundred thousand dollars or more for this kind of information. Research organizations would charge $1,495. Seriously. Ask both audiences.

Online Marketing Simulations will be one of my two key consulting project focuses over the next twelve months (the other project focus, of course, is Multichannel Forensics). This topic isn't going away. I'll be happy when I have plenty of consulting projects and the leading web analytics vendors incorporate this methodology into their software offering, so that all of us can easily access this information. I would like to politely ask you to help make that happen, that you ask your software providers to help arm you with the tools necessary to make good long-term decisions. Our industry simply lacks tools that allow really talented analysts to optimize conversion rates in a way that guarantees long-term success.

Labels: ,

October 07, 2009

OMS: Price Points

It's trendy in online marketing to entice customers to purchase with low price points, discounts, and promotions.

But is it healthy for you business, in the long-term?

Let's look at an example from the OMS Spreadsheet (e-mail me if you wish to follow along, I'll send you a copy).

Zero out cells D6 - G6.

Zero out cells B101 - B580.

Now we're going to compare the evolution of two segments of new customers.

Go to cell B419, and enter the number "1,000". Now go up to the top of the spreadsheet, and look at cells C17 - G18. In the future, these customers like to purchase 3-4 items per order, spending $30 to $40 per item. In the year the customers were acquired, they spent $159,000. These customers basically stay stuck in department 11.

Next, zero out cell B419, and instead enter "1,000 into cell B421. Now go up to the top of the spreadsheet, and look at cells C17 - G18. In the future, these customers like to purchase much more expensive items. In the year the customers were acquired, they spent $147,000 ... but these customers are likely to migrate to expensive items in department 15. These customers hold much more potential than do other customers.

Online Marketers have the opportunity to carefully link the micro-channel the customer purchases from with the merchandise the customer purchases and the price point of the merchandise purchased. The combination of micro-channel, merchandise, and price point yield a customer that has outstanding potential, or limited potential.

This is an important area for online marketers to provide attention to!!

Labels: ,

October 05, 2009

OMS: Merchandise Mix

If you'd like to follow along, please send me a message via e-mail, and I'll send you a copy of the spreadsheet.

Today we're going to talk a little bit about the role that merchandise mix plays in a business. Our online businesses are often managed by campaigns and landing pages. We execute offline campaigns (catalogs or direct mail or whatever works for you), and we execute a ton of online campaigns.

On average, we don't care what sells nearly as much as we care about the campaigns that work. We optimize our business based on the campaigns that deliver an acceptable return on investment.

But what happens when we cause customers to buy a different set of merchandise? In other words, does the future of the business change if I influence the merchandise that a customer purchases?

Give this a try. Zero out cells C5 - G5. Zero out cells B101 - B340. Enter "1,000" into cell B130.

Notice that these customers love Merchandise Department 11. After five years, they still spend more than half of their money in this department. After five years, the customers who stay active purchase 2.6 times a year, purchasing 2.9 items per order at $80 per item.

Now zero out cell B130, and type "1,000" into cell B136. These customers love Merchandise Department 14, but these customers are at least a little bit more willing to shift their money across other departments. After five years, the customers who keep active purchase 2.6 times a year, purchasing 2.6 items per order at $105 per item.

This is a tame example, one where the customer is fundamentally different, but the outcome after five years is not dramatically different.

That being said, it's a good thing for you to pay attention to this trend. Are your keywords causing you to acquire customers who have a preference for only a specific item or set of items, causing you to not achieve the long-term potential you'd like to achieve? Do your e-mail campaigns influence the merchandise preferences of your customers?

Labels: ,

September 30, 2009

OMS: Constant Decay And Reactivation

If you want a copy of the OMS (Online Marketing Spreadsheet) to follow along with, please e-mail me, and I will send you a copy.

Ok, let's look at another issue with your online business, the issue of "decay".

For the past fifteen years, we've lived in an environment of unfettered e-commerce growth. Everything was easy. Lick you finger, point it to the sky, and guess that next year's growth will be 35%. And then it would come in at 45%. You'd look like a genius. Those were good times!

Well, growth was happening because new customers were trying e-commerce. Most customers have tried e-commerce now. Growth is harder to come by.

It is important to understand how a segment of customers experiences "constant decay". Here's what I want for you to do:
  • Zero out cells C6 - G6.
  • Zero out cells B101 - B340.

Now, enter the number "1,000" into cell B117. We're going to see how 1,000 really good customers (in my model, they are graded as "A") will evolve over time.

Take a look at the results.

  • Grade = "A": Year 1 = 596, Year 2 = 380, Year 3 = 254, Year 4 = 177, Year 5 = 128.
  • Grade = "B": Year 1 = 217, Year 2 = 220, Year 3 = 198, Year 4 = 172, Year 5 = 148.
  • Grade = "C": Year 1 = 186, Year 2 = 293, Year 3 = 289, Year 4 = 255, Year 5 = 217.
  • Grade = "D": Year 1 = 0, Year 2 = 106, Year 3 = 209, Year 4 = 251, Year 5 = 251.
  • Grade = "F": Year 1 = 0, Year 2 = 0, Year 3 = 50, Year 4 = 145, Year 5 = 257.

Sales keep declining, too, from $400,000 in Year 1 to $89,000 in Year 5.

E-commerce is in a state of "constant decay". Without a steady diet of new customers, the whole ecosystem simply essentially falls apart. This is happening to your business, every single day ... you just mask it by finding new customers. Strip out the new customers, and you're on your way to being laid off.

You'll hear catalog marketers obsess about "customer reactivation". This is why. They know, from a hundred years of catalog marketing experience, that their customer file is in a state of constant decay, so they obsess about every possible strategy to get customers who haven't purchased in a long time to come back and buy again.

Reactivation is hard work, and the rewards aren't dramatic. Go ahead and plug "1,000" customers into cell B261. These customers have a grade of "D". Notice that very few of these customers ever move up into "A" or "B" status (see cells C21 - G25).

Now do something unique. Change the value of "1.00" in cell C5 to a value of "1.20". In other words, for one year, we're going to do something, whatever that is, that improves the ability to reactivate these customers by twenty percent. What do you see?

Well, you see very, VERY modest improvements in the number of customers achieving "A" and "B" status over time. Clearly, it is very hard to reactivate customers. But if you can do it, on a grand scale, year after year after year, it will pay dividends.

Now update C5 - G5 from a value of 1.00 to a value of 1.20. All of a sudden, we have 122 "A" customers after five years, vs. just 91 if we improve reactivation for one year, and vs. just 89 if we do nothing but let customers migrate organically.

In other words, customer reactivation is a 24/7/365 activity that must be managed with discipline. Constant improvement and strategy is required, every day, every year, to move the needle. If the attention isn't given, then the e-commerce business is in a state of constant decay.

If you're an Executive or Analyst looking to understand what the future trajectory of your business looks like, give me a holler about working on an OMS project!

Labels: ,

September 28, 2009

OMS: MVP = Most Valuable Path

When you take a few moments to read articles about online marketing, you quickly learn that the goal is to get a conversion ... NOW!

What happens if the customers you acquire aren't very good long-term prospects?

Time to pull out the OMS and see if that happens! If you want to follow along, send me an e-mail message, and I'll send you the free spreadsheet with 80% of the content I use when working with my clients.

Here's what I want for you to do:
  • Zero out cells D6 - G6, we only want to acquire customers in the first year.
  • Zero out cells B101 - B340, the cells that have the number of customers by segment to start the simulation with.
  • Now, zero out cells B341 - B580. These are the cells that tell us how many people we're going to acquire. I have 240 segments, I add "300" to the segment label on each of these ... so segment 412 is really segment 112.

Ok, now let's try something. Plug the value "1,000" into cell B452. We're going to track what happens when we acquire 1,000 customers into what is Segment 112, a cell graded as a "C". What do you observe:

  • Almost all of these customers purchased from online marketing channel number two (see cell J6).
  • Almost all of these customers purchased merchandise from department number 11 (see cell J15).
  • After the first year, almost none of these customers purchased again, generating about $35,000 over the next four years.
  • When acquired, these customers typically bought 1.8 items at $17.49 per item.

Now let's try something different. Zero out cell B452, and instead, plug the value "1,000" into cell B477. Look at these customers.

  • Almost all of these customers purchase from online marketing channel number one (see cell J5).
  • Almost all of these customers purchased merchandise from either department numbers 15 and 19 (see cells J19 and J23).
  • After the first year, some of these customers purchased again, generating about $121,000 over the next four years.
  • When acquired, these customers typically bought 1.4 items at $30.28 per item.

There's a fundamental difference in the subsequent behavior of these customers, right? Which customer would you want to acquire?

This is part of the art of online marketing that is missing these days. We look at conversion metrics, and determine if we did well or not. By folding in the merchandise a customer purchased (and the price point the merchandise is offered at), and simulating what is likely to happen in the future, we see a different story --- we can identify the marketing channels (offline, e-mail, search, affiliates, etc.) that yield high-value customers, and we can identify the merchandise that we should advertise, merchandise that yields high-value customers.

This is part of something I call the "MVP", or "Most Valuable Path". What we want to do is understand how customers progress through our ecosystem, identify that path (micro-channel + merchandise + geography + price point) that yields a high value customer, and then acquire customers who take the Most Valuable Path.

Make sense?

Homework assignment: Describe the dynamics that happen when you acquire 1,000 customers from segments 349, 350, 355, 357, and 364. Which segment yields customers with the most future value? What do you see happening that is driving this?

Labels: , , ,

September 24, 2009

OMS: A KPI For You, Customer Asset Value

Let's do something nuts with our spreadsheet (e-mail me here to obtain your free copy of the OMS 240 Segment Simulation Spreadsheet).

Go to cells C6 - G6, and type in the number 0.00 in each cell.

This means that there will be no customer acquisition in each of the next five years.

Now look at the sales numbers in C13 - G13:
  • Year 1 = $62.6 million.
  • Year 2 = $50.5 million.
  • Year 3 = $40.9 million.
  • Year 4 = $33.7 million.
  • Year 5 = $28.4 million.

Looks like customer acquisition is pretty important, huh? How many times have you been told that if you just fix your loyalty program, everything will be fine?

But maybe more important is this interesting metric.

  • This business generated $80.0 million last year.
  • Over the next five years, this business will generate $216.1 million from the existing customer base.

Your customer base is an asset, in this case, one worth $216.1 million in the next five years.

Some companies calculate this metric (five year sales value of current customer base, what I call the "Customer Asset Value", or "CAV") on a weekly/daily basis, allowing them to see how marketers and merchants positively/negatively impact a business --- in ways that go way beyond conversion rates.

This is a KPI every company can calculate. Ask your Web Analyst to calculate this metric for you. Ask your Business Intelligence Manager to calculate this metric for you. Ask me to calculate this metrics for you!

Labels: ,

September 23, 2009

OMS: Customer Acquisition

If you haven't received your copy of a sample Online Marketing Simulation worksheet and wish to follow along on these examples, go ahead and send me an e-mail message and I'll forward you a copy.

In our example, we estimated that this business needs a 17% increase in customer retention, in order for the business to improve.

What about customer acquisition?

In the spreadsheet, change cells C6 - G6 from a value of 1.00 to a value of 1.70.

Notice that the business stabilizes when customer acquisition activities drive a 70% increase in new customers.

This doesn't even seem feasible, does it? I mean, how the heck would you improve customer acquisition activities by 70%?

In upcoming posts, we'll explore how to investigate which customer acquisition segments can contribute high-value customers. We'll introduce the concept of the "MVP", the "Most Valuable Path" that a customer follows from new customer to great customer. We'll better understand what drives this business, and what holds back this business. You'll be able to take the concepts and apply them to your business.

Labels: ,