Kevin Hillstrom: MineThatData

Exploring How Customers Interact With Advertising, Products, Brands, and Channels, using Multichannel Forensics.

August 09, 2009

From Conversion Rate to Repurchase Rate to Multiple Probabilities

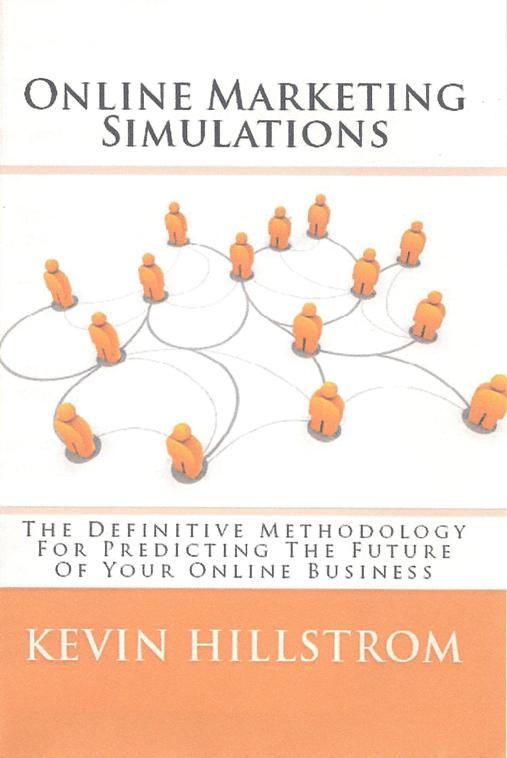
We're up to the third part in our series on Web Analytics and Online Marketing Simulations (OMS).

My central thesis is that by emphasizing conversion rates, we optimize our business based on the advertising sources that cause a customer to purchase now. By doing this, we create an inefficiency. We overlook customers who yield a positive outcome in what we deem an inefficient manner.

Here's an example.
  • We all know that pay-per-click customers convert at less-than-thrilling rates.
  • We know that pay-per-click customers can be expensive, maybe costing us $0.10 per click, or $0.40 per click, or $0.70 per click.
  • Over time, pay-per-click customers can become e-mail subscribers.
  • And e-mail subscribers often have higher-than-average conversion rates if they click-through an e-mail campaign.
  • And e-mail marketing is really close to free, having virtually zero variable cost.

If we want to optimize conversion rates, we'll steer ourselves away from expensive pay-per-click programs with low conversion rates, right? At the same time, we'll want to maximize our e-mail marketing program, with low costs and high conversion rates.

If we want to optimize repurchase rates, we'll take a different action. We want pay-per-click customers, because pay-per-click customers become e-mail subscribers. We want to optimize the multi-year process of acquiring an expensive pay-per-click customer who becomes a profitable e-mail customer.

If we optimize via conversion rate, we won't "seed" our business with the pay-per-click customers who become e-mail subscribers with high conversion rates. We optimize our business in the short-term, but create a long-term inefficiency that limits our ability to grow over time.

We have an opportunity to add to our responsibilities. We have an opportunity to measure what are called "conditional probabilities". Here are examples of conditional probabilities:

  • What is the probability of a customer becoming an e-mail subscriber, given that she last purchased via pay-per-click?
  • What is the probability of a customer becoming a loyal customer, given that she has become an e-mail subscriber?
  • What is the probability of a customer buying from multiple channels, given that she has become a loyal customer?

By linking each of these conditional probabilities, we arrive at a customer that generates an optimal amount of profit, over time. Within each step, we may have numerous instances of sub-optimal conversion rates, but those sub-optimal situations result in a customer that is optimally profitable. We combine conditional probabilities with demand and profit calculations, allowing us to simulate the future based on the actions we manage today.

From an Advanced Web Analytics standpoint, we create a table that records customer actions in a prior period of time, and in a future period of time. In the future period of time, we also tag the amount of demand the customer generated in the future period of time. The list of variables below is not exhaustive, and variables can be combined (receive catalog, buy via pay-per-click), creating what I call "micro-channels".

Prior Period of Time (1 = yes, 0 = no).

  • Did customer visit the website?
  • Did customer put merchandise in a shopping cart?
  • Did customer purchase from the website?
  • Did customer purchase multiple times from the website?
  • Did customer purchase via e-mail?
  • Did customer purchase via pay-per-click?
  • Did customer purchase via affiliates?
  • Did customer purchase via offline catalog marketing?
  • Did customer purchase via display ads?
  • Did customer purchase via social media?

The same set of variables are replicated for a future period of time, along with demand and profitability (if available) metrics. Obviously, the same customer will not have the same attributes, as customer behavior changes.

The prior timeframe is usually defined as a year, the future timeframe is usually defined as a year. That being said, there's no reason you cannot explore different timeframes, weeks, months, seasons, etc. However, you identify more inefficiencies, more opportunities for profit, when you lengthen the timeframe.

When the dataset is created, the analysis begins. We begin to link the conditional probabilities together, finding customer behavior that leads to long-term sales and profit. In our next blog post in this series, we'll begin to explore how this information comes to life.

Labels: , , ,

August 04, 2009

From Conversion Rates To Repurchase Rates

In Moneyball, Michael Lewis explained how the Oakland A's, with a very low payroll, optimized wins by finding market inefficiencies. Baseball historically focused on metrics like batting average and runs batted in. Oakland focused on "on base percentage" and "slugging percentage", finding athletes who generated good outcomes in these metrics at lower-than-average salaries.

In other words, the existing best practice was to find great athletes with good batting averages and an ability to drive in runs. Oakland identified a different set of metrics, and then found players who were good at generating these metrics at a low cost. Oakland won a ton of games from 1999 - 2006, using this methodology.

In Online Marketing, we look to optimize conversion rate, and we have the best set of tools we've ever had to do this style of optimization.

But we're not making big strides in understanding how to increase customer spend over time. In other words, we work really hard to increase conversion rates, maybe from 4.1% to 4.5%. But we somehow aren't able to engage customers in a way that increases loyalty. E-commerce sales have largely grown from traffic, not from increases in repurchase rates, orders per buyer, items per order, or price per item. In the future, growth must come from increases in repurchase rate, orders per buyer, items per order, and price per item.

So if you are an online marketer, I'm going to encourage you to evolve your thinking. I'm not going to ask you to abandon all of the metrics and optimization strategies you've historically employed. I am going to ask you to think differently.

Let's start by defining a metric. The name of the metric is "Repurchase Rate". Simply put, this metric is defined as the percentage of customers who purchased last year, and then purchase again this year. Now if your business is not an e-commerce business, then go ahead an think about whatever the "action" is that you want to maximize --- if you are Twitter, you might look at a "Re-Use Rate", how many people use your service again today, given that they used your service yesterday.

Why is "Repurchase Rate" important? Let's look at two customers. Both customers purchased one time during 2007, on December 10, 2007:
  • Customer #1: Visit 2/1/2008, Visit 2/8/2008, Visit and Buy 2/12/2008, Visit 7/1/2008, Visit and Buy 7/2/2008, Visit 9/10/2008, Visit 10/1/2008, Visit 12/1/2008.
  • Customer #2: Visit and Buy 2/15/2008, Visit and Buy 7/2/2008, Visit 12/1/2008.

Both of these customers have a 100% "Repurchase Rate", and both customers ordered two times during 2008. Both customers last visited the website on 12/1/2008. In many ways, both customers yield the same outcome --- both customers purchased twice during 2008.

But from a "Conversion Rate" standpoint, these customers are very different. Customer #1 has a much lower conversion rate than does Customer #2. Our web analytics tools are often configured to favor Customer #2.

When we favor Customer #2, we favor the actions that cause Customer #2 to come to our website. And as a result, we will spend more money, via optimization, on the actions that generate a lot of customers who look like Customer #2.

So my thesis is this: Why not look for the actions that generate customers who have good Repurchase Rates? By optimizing "Repurchase Rate", a metric measured across a multi-month or multi-year period of time, we find customers who may look bad when measured via "Conversion Rate", but are equally or more valuable to the long-term health of the business.

In other words, there is a market inefficiency that exists when everybody focuses on "Conversion Rate". By instead focusing on "Repurchase Rate", we identify customers who appear to be poor converters, but spend the same amount in the future as do other customer who convert well. The secret is that we can grow our business faster than our competition, because we are optimizing on a different set of measures.

Next week, we'll begin to explore the math that allows us to optimize via "Repurchase Rate". The math will lead us to a simulation environment that helps us understand the long-term impact of short-term decisions.

Labels: , , ,

August 02, 2009

Web Analytics, Online Marketing, Metrics

Note: Every Monday and Wednesday in August, we'll be talking about Web Analytics and Online Marketing Simulations (OMS). The discussions will build in depth and math as the month moves along.

There's never been a better time to be a Web Analytics expert!

There's never been a more challenging time to be a Web Analytics expert, either.

Do you want to know how customers who visit your site via iPhones convert? No problem! Care to measure the bounce rate of new customers? Have at it! Need to know the cost per conversion of visitors from Wyoming visiting because of PPC? Easy!

Online marketing is calibrated around a metric called "conversion rate". We are able to segment visitors via a veritable plethora of dimensions, using a mouse to drop in metrics based on dimensions we define on the fly. It's easy, it's fun, it is actionable, it increases sales! More important, we're able to create A/B tests, allowing us to optimize our results in real time. Technically, we know more about how customers interact with advertising than ever before. What's not to like about being a Web Analytics expert?

That's one side of the spectrum.

Over on the other side of the spectrum are what I call "strategic questions". Strategic questions are a different animal altogether. Strategic questions are harder to answer, because the answer isn't found by using metrics to optimize conversion rate.

Strategic Question #1: You are a retailer with three stores in Akron, OH. Management is considering closing one store, and is hoping that the other two stores and your e-commerce website will pick up the sales lost if one store is closed. What is the impact on website sales if one store is closed?

Strategic Question #2: Your merchandising team added a new product line in July. This product line is already responsible for 5% of company sales, a huge success. However, the product manager for an existing product line experienced a 25% reduction in sales in July. She believes that the new product line cannibalized her assortment. Other product managers don't agree, because their products experienced sales gains during July. Nobody tested offering/not-offering the new product line to customers. What impact did the new product line have on the old product line?

Strategic Question #3: You implemented five new initiatives. Each initiative increased conversion rate, based on A/B tests, by 10%. And yet, in total, your conversion rate is down 10% vs. last year. Your CEO holds you accountable for increasing conversion rate. How are you going to demonstrate that the conversion rate decrease is not your fault? What offline data do you need to make your case to management?

Strategic Question #4: Management is considering closing down your catalog division. Management wants to know what e-commerce sales will look like in 2015 if there has not been a catalog to support e-commerce sales for a five year period of time. What is your estimate for e-commerce sales in 2015, without a catalog division there to support e-commerce sales?

Here's the trap that the Web Analytics expert is in. All of the big Web Analytics providers (Coremetrics, Unica, Omniture, for example) can help you answer these questions. You can, in theory, import data or link to data or export data or build a data mart and, technically, get to an acceptable answer.

But if your focus is on the powerful combination of conversion rates and optimization, it will be hard to conceive an analytical framework that yields an answer acceptable to a CEO.

As mentioned a few weeks ago, we're going to spend a lot of time in August exploring how our focus on conversion/optimization limits our ability to answer strategic questions. In August, we'll show how we can use a simulation environment to better understand strategic issues in online marketing. We'll explore how we can see the future via a different framework.

If you want to prepare for our month-long discussion, consider these authors, folks who use different metrics to re-define their craft, or explain how the "new" is really borrowed from the "old".

  • Basketball: The Wages Of Wins, explaining why scoring does not lead to wins.
  • Football: Advanced NFL Stats, illustrating the ways that traditional metrics fail to explain success.
  • College Football: Smart Football explains why the "spread" offense is not orginal, is largely borrowed from plays from fifty or more years ago.
  • Here's an article about Patrick Ewing that has many similarities to Web Analytics, arguing that you optimize the end result by sub-optimizing components, by having less talented players shoot more so that the best player's performance is optimized. Of course, this is contrary to Web Analytics and Online Marketing theory, but it does help explain why a decade of optimization sometimes leads us to lower conversion rates over time.

Labels: , , ,